
Video-Based Gaze Detection for Oculomotor Abnormality Measurements

NeuraLight Inc., 8 The Green #16790, Dover, DE 19901, USA
*
Author to whom correspondence should be addressed.
†
These authors contributed equally to this work.
Appl. Sci. 2024, 14(4), 1519; https://doi.org/10.3390/app14041519
Submission received: 10 January 2024
/
Revised: 8 February 2024
/
Accepted: 10 February 2024
/
Published: 13 February 2024
(This article belongs to the Special Issue Eye-Tracking Technologies: Theory, Methods and Applications)
Abstract
:Measuring oculomotor abnormalities in human subjects is challenging due to the delicate spatio-temporal nature of the oculometric measures (OMs) used to assess eye movement abilities. Some OMs require a gaze estimation accuracy of less than 2 degrees and a sample rate that enables the detection of movements lasting less than 100 ms. While past studies and applications have used dedicated and limiting eye tracking devices to extract OMs, recent advances in imaging sensors and computer vision have enabled video-based gaze detection. Here, we present a self-calibrating neural network model for gaze detection that is suitable for oculomotor abnormality measurement applications. The model considers stimuli target locations while the examined subjects perform visual tasks and calibrate its gaze estimation output in real time. The model was validated in a clinical trial and achieved an axial accuracy of 0.93 degrees and 1.31 degrees for horizontal and vertical gaze estimation locations, respectively, as well as an absolute accuracy of 1.80 degrees. The performance of the proposed model enables the extraction of OMs using affordable and accessible setups—such as desktop computers and laptops—without the need to restrain the patient’s head or to use dedicated equipment. This newly introduced approach may significantly ease patient burden and improve clinical results in any medical field that requires eye movement measurements.
1. Introduction
With the development of computational technology and automated machinery, eye movement measurements—specifically, gaze detection and tracking—have gained increasing interest in recent decades. Some applications of gaze detection aim to improve the user interface and engagement with various external complex controlled systems; for example, gaze-based human–computer interactions [1,2] enable the hands-free operation of software, while safety and awareness gaze-based assessments ensure the optimal functionality of drivers [3], pilots [4], and even surgeons [5,6]. Another set of applications intends to harness the remotely detected gaze to map the saliency of selected items in the overall field of view. Advertisement and marketing-oriented studies [7,8] have extensively implemented gaze detection, and tourism researchers have performed gaze detection along with the measurement of other emotional and physical metrics to estimate reactions to particular items or sights [9].
Another rapidly extending set of gaze detection applications is aimed at non-invasive measurement of eye movements in patients with various diseases. As a primary apparent output of the oculomotor system, gaze detection time-series data allow for further derivation and extraction of the eye movement features directly associated with a subject’s cognitive and motor functionality, enabling the detection of eye movement abnormalities that may be related to the patient’s condition.
Eye movement abnormalities refer to deviations or irregularities observed in the typical characteristic patterns of eye motion in healthy individuals. Such deviations may be indicative of underlying neurological, ophthalmological, or vestibular disorders, making them significant diagnostic indicators for clinicians [10].
The human eye engages in various movement types, including saccades (rapid movements between separate fixation points), smooth pursuit (continuously tracking moving objects), and nystagmus (involuntary rhythmic oscillations of the eyes). Abnormalities in these movements may manifest in various OMs in terms of accuracy, speed, co-ordination, and response patterns with respect to visual stimuli.
Abnormal eye movements may be the result of factors such as damage to the neural pathways governing eye movements [11], dysfunction in the muscles responsible for ocular motion [12], or disruptions in the vestibular system (which processes spatial orientation and balance) [13]. Consequently, eye movement abnormalities are observed across a spectrum of conditions, including those affecting the central nerve system (CNS) such as multiple sclerosis [14,15], Parkinson’s disease [16,17], and amyotrophic lateral sclerosis (ALS) [18,19]. Therefore, extracted eye movement features (i.e., OMs) have potential as new biomarkers for the diagnosis of several CNS diseases [16,18,20,21], strongly correlating with the patient’s condition and disease progression [22].
Clinicians routinely examine and assess eye movements as a diagnostic tool. Monitoring the accuracy, velocity, and co-ordination of eye movements provides valuable insights into the integrity of neural circuits involved in visual processing and motor control. While clinicians have conducted eye movement examinations for decades, the OMs extracted without specialized equipment or laboratory setup are limited, mainly due to the required temporal and spatial sensitivity. For instance, Saccade movement duration (the time from initialization of the movement until the first stop of the eye) may reach values in the order of 100 ms, posing challenges for the manual detection of eye movement abnormalities. Therefore, the introduction of gaze detection tools with high spatio-temporal accuracies is expected to enable the extraction of the relevant OM, allowing for a more confident observation of eye movement abnormalities.
Although humans can quite accurately detect someone else’s gaze visually (i.e., tell where that person looks), the equivalent technology used to locate a human subject’s point of regard (PoR) is still lacking. The most commonly used eye trackers at present are Infrared (IR) active sensors, which track the eye’s position and orientation to estimate the subject’s PoR. These specialized IR eye trackers are currently considered to be the most accurate measurement tool for gaze detection and can be mounted next to a desktop monitor [23] or embedded in wearable head devices (e.g., glasses) [24]. However, even in state-of-the-art IR eye trackers, researchers have observed significant sensitivity to the experimental setup and the diverse characteristics of subjects [25].
Video-based gaze detection has been in development since the 1970s, with many limitations and restrictions imposed on the experimental setup (e.g., fixed head position, an array of mirrors around the subject, multiple camera deployment) and light sources [26,27]. However, advances in hardware since the early 2000s have accelerated the development of video-based gaze detection using standard, affordable web cameras, with their resolution, sensitivity, and frame rate having significantly increased, thus enabling more accurate gaze detection using existing analytical algorithms. In recent years, both computation and storage costs have dropped while data transfer bandwidths have widened, enabling the introduction of efficient and robust neural network (NN) models for video-based gaze detection [28]. This recent leap has encouraged the development of high-accuracy, video-based gaze detection, which may be applied for all the above purposes, with an affordable price tag and a convenient and flexible (ideally seamless) setup.
We introduce and test a gaze detection model that combines several neural network models for eye detection, eye segmentation, and gaze estimation with an ongoing real-time calibration procedure. Our study is aimed at the neurological applications of gaze detection and considers the essential measurement for the extraction of OMs, performed using a simple and affordable setup that presents visual stimulation tasks and processes the video of the gazing subject captured using a webcam. As some OM classes (e.g., saccadic latency) require high spatio-temporal resolution, high accuracy is required when extracting the gaze PoR in each video stream frame.
In this paper, we present our gaze detection model, along with its validation and error estimation results. Section 2 describes the gaze detection model and the clinical study environment, including the experimental setup, examination protocol, and the demographic data of participants. Section 3 provides the results of the video-based gaze detection model, compared to a reference specialized IR eye tracker for validation. In Section 4, we discuss our findings.
2. Materials and Methods
2.1. Gaze Detection Model
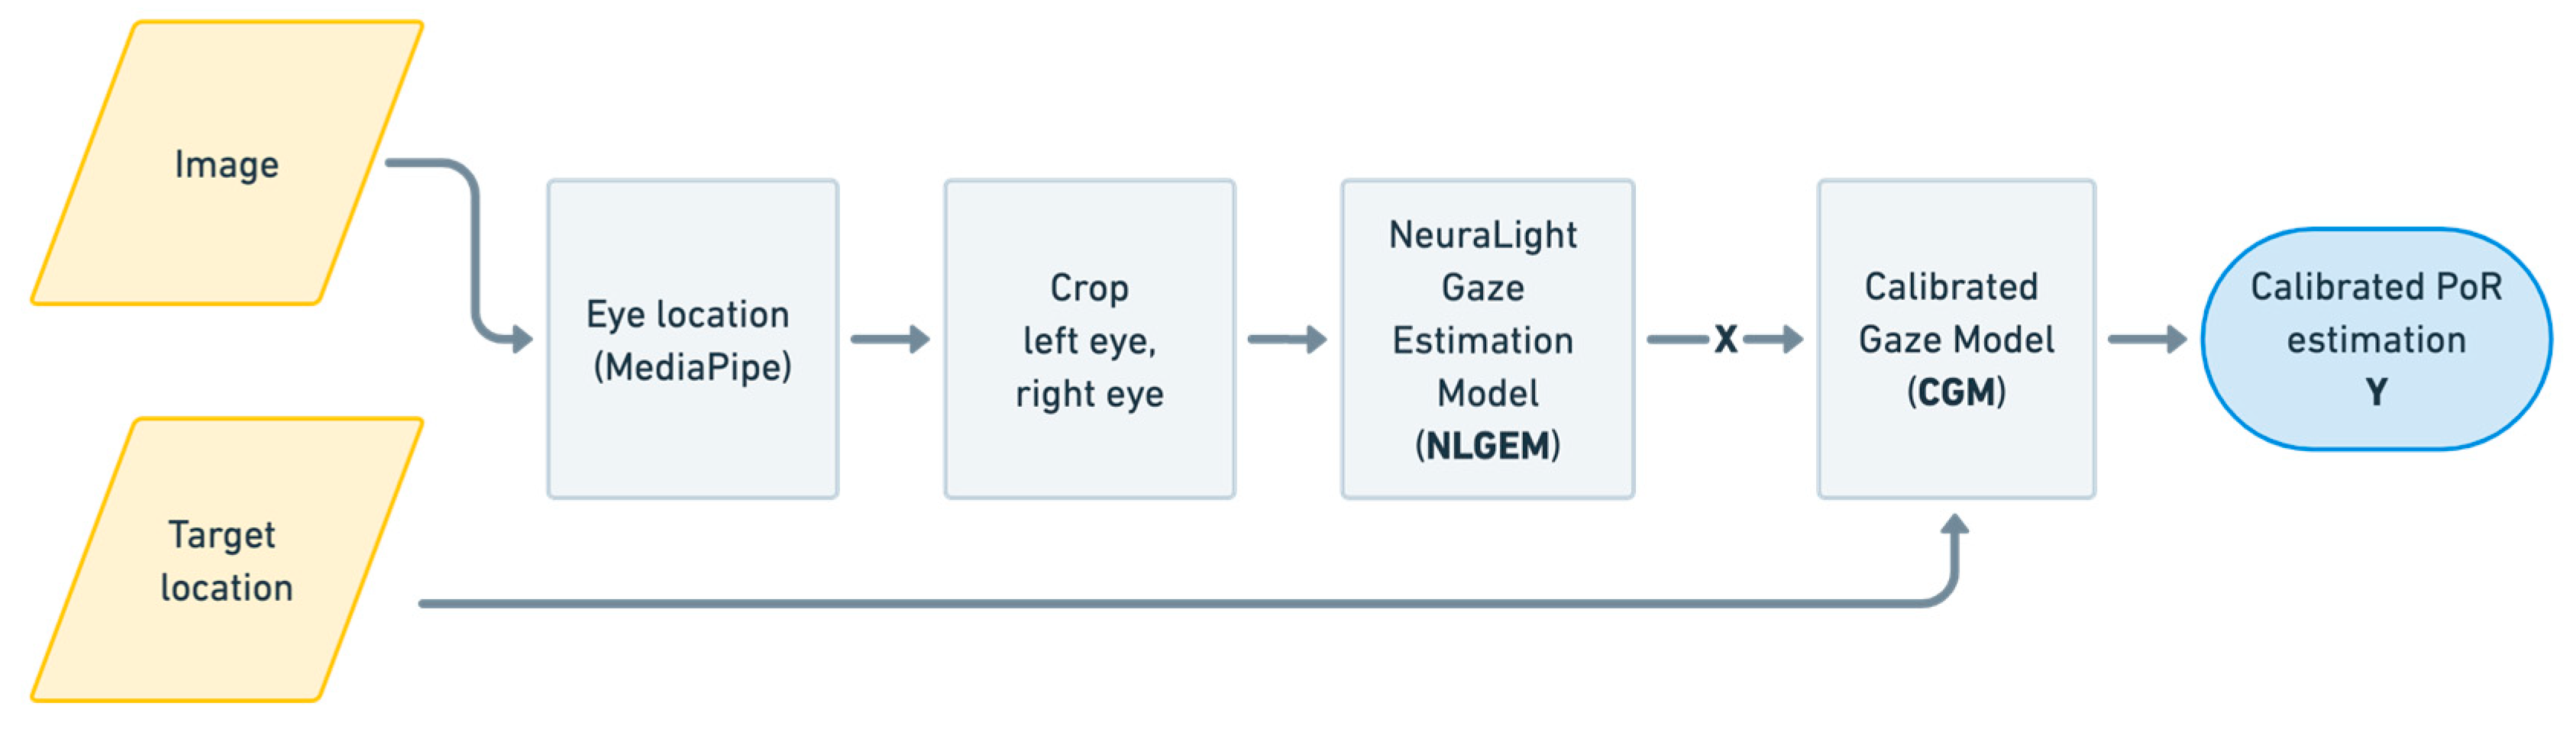
The gaze detection model used in this study was developed based on existing published NN models for video-based eye detection, eye segmentation, and gaze detection [22,28], with the addition of information regarding visual stimuli target locations, as depicted in Figure 1.
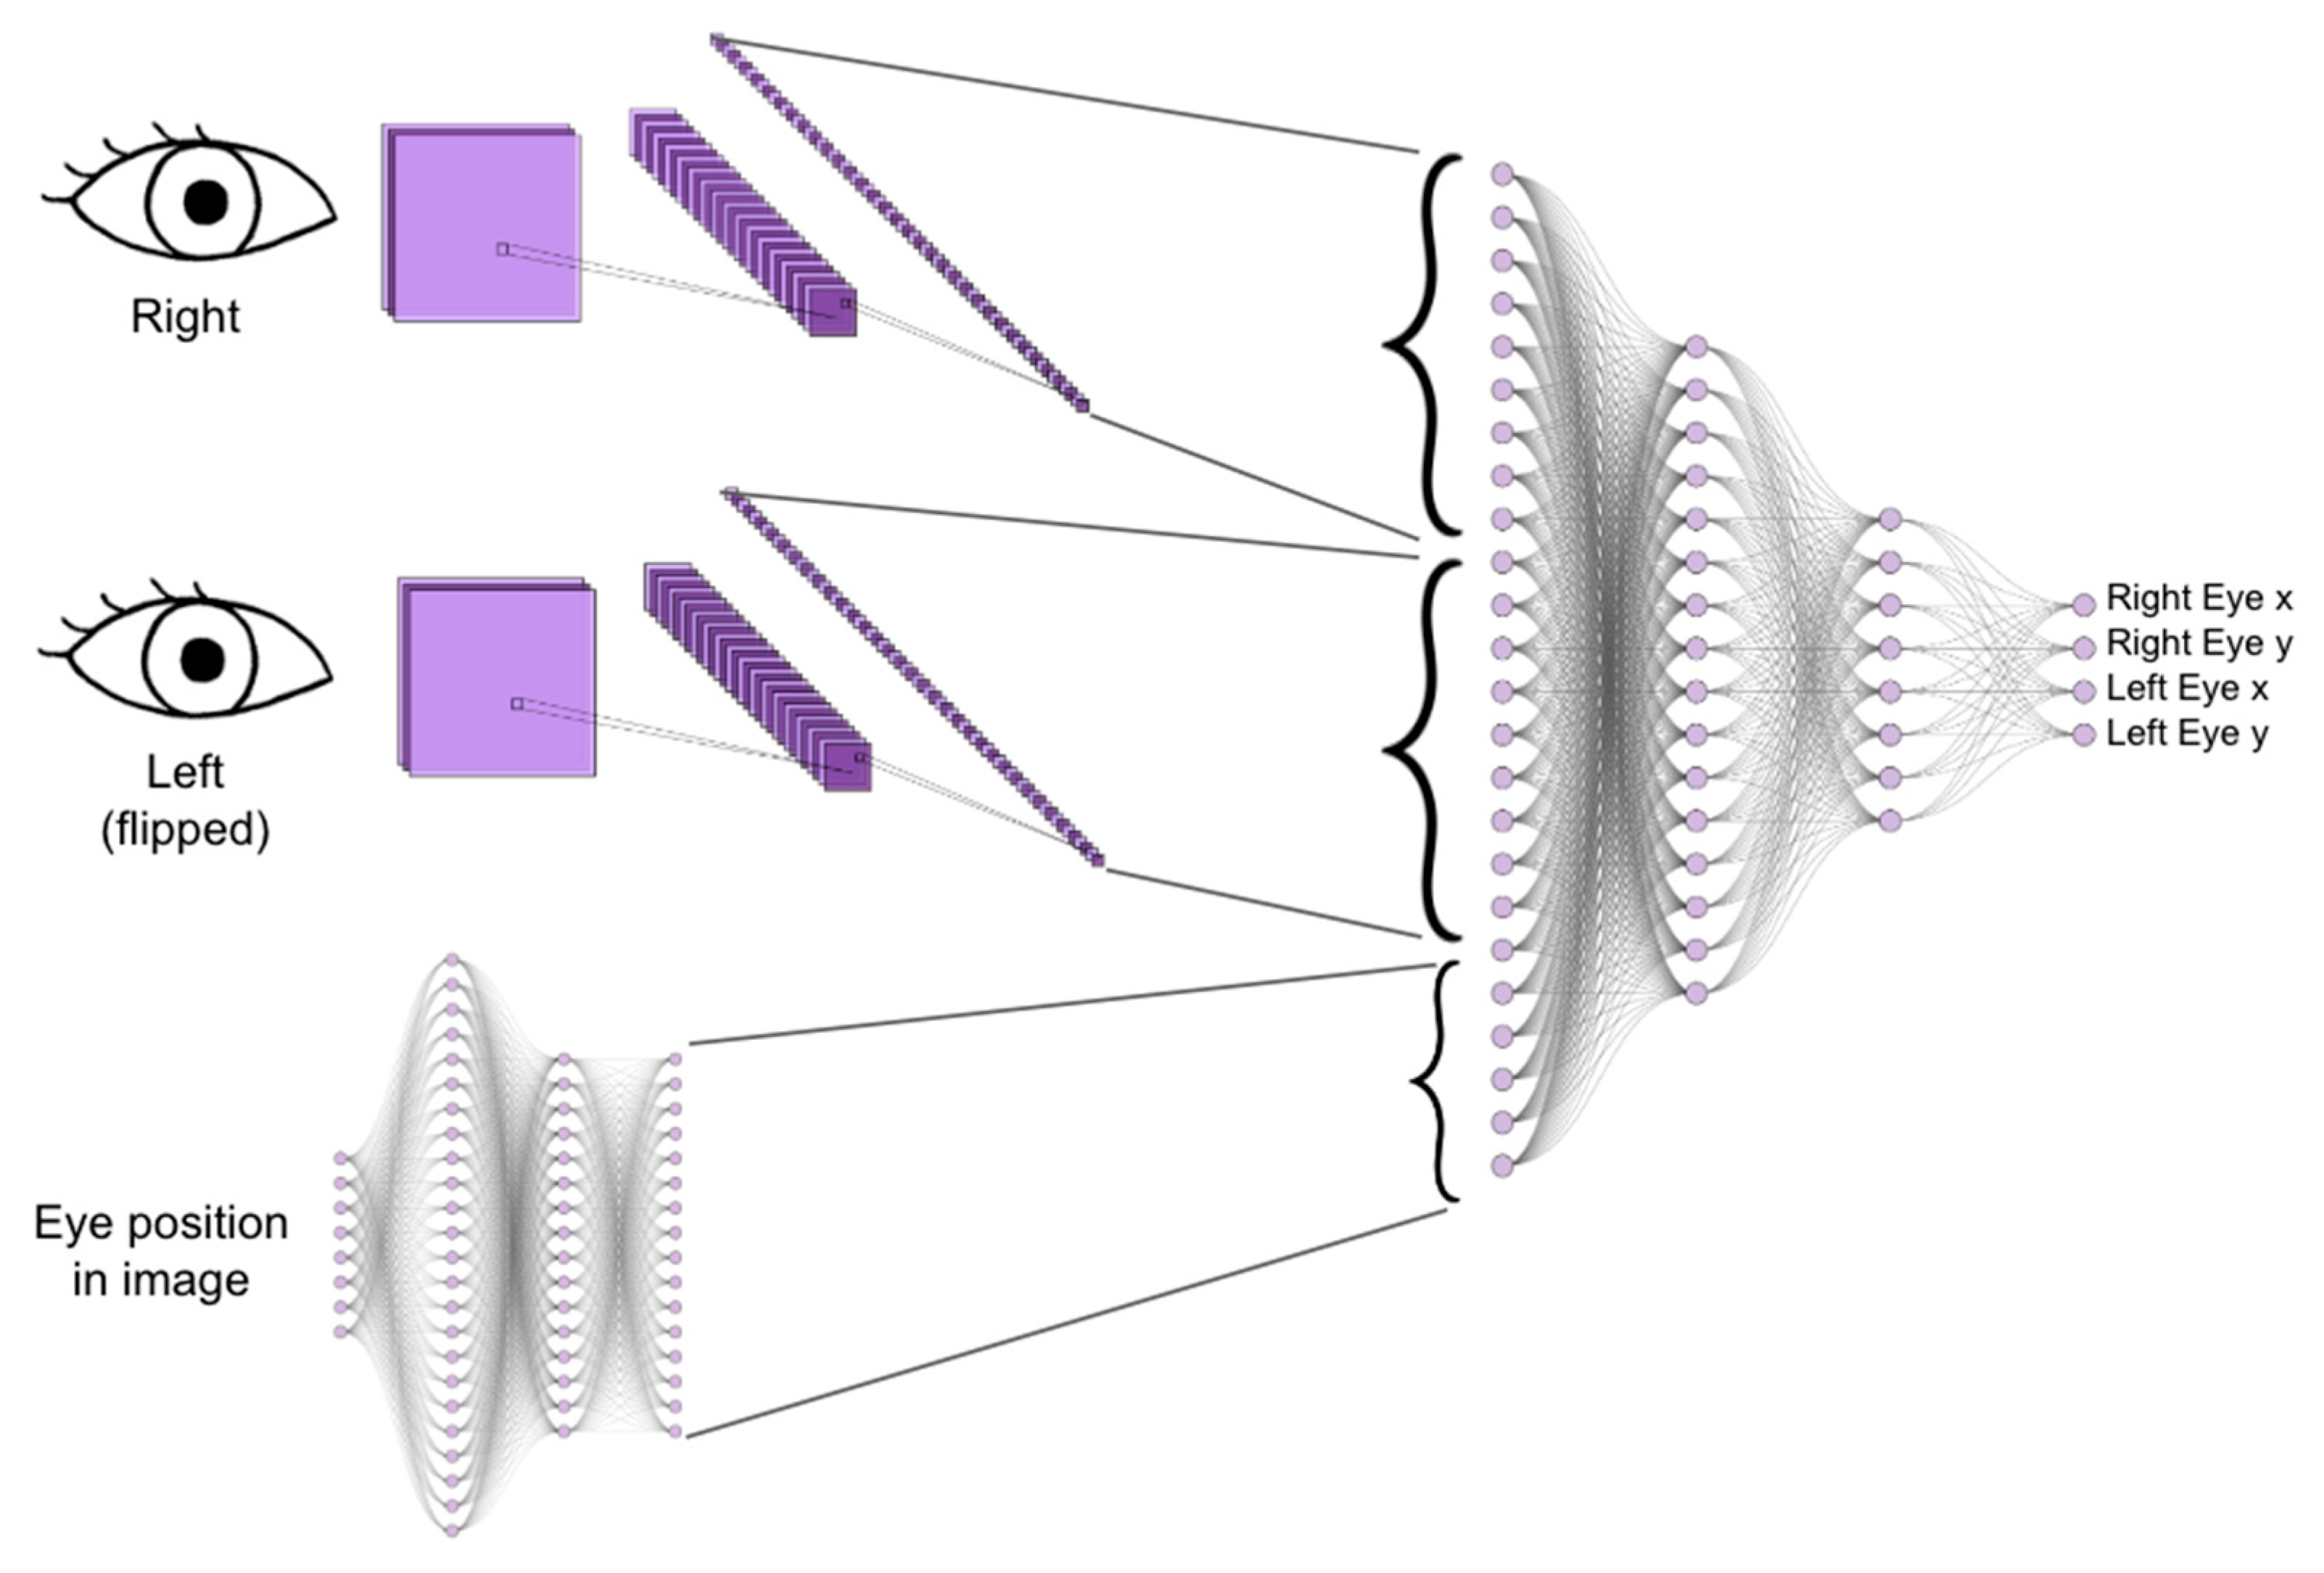
The initial input—namely, an image containing the subject’s face—is first processed using the MediaPipe neural network. The MediaPipe Face model [29] detects face landmarks from still images or video; specifically, landmarks around the eyes, such as the iris and the eyelid boundaries. These landmarks are used to extract the eye position in each image. Then, using the eye position information, two smaller images of the left and right eye are cropped from the original image, of which one is horizontally flipped, as is common practice in the field [20], in order to optimize training by assuming symmetry of the extracted features. The cropped eye images, along with the eye position in the image, are then passed into the NeuraLight Gaze Estimation Model (NLGEM), the general architecture of which is shown in Figure 2.
The NeuraLight Gaze Estimation Model is a deep neural network (DNN) composed of three distinct modules: (1) A Convolutional Layers Module, including two equally weighted networks (for the two eyes), which extracts relevant features from eye images using convolutional layers; (2) Fully connected layers (Eye Position Data Module), which generate features based on eye position data (i.e., this module processes spatial information); (3) Integration layers (Combination Module), which utilize fully connected layers to combine the features extracted from the image (module 1) and spatial information (module 2). The output is mapped into the target PoR co-ordinates for each eye, denoted as X.
The NLGEM model was trained using 109 subjects as a part of a large healthy subject cohort [30] examined in 925 sessions, with 153,119 frame samples. The NLGEM training cohort included 70 males and 39 females, with a mean age of 41 and a standard deviation of 18.5 years and with the IR eye tracker readings as the training labels.
The NLGEM output gaze point co-ordinates of the two eyes are averaged into a single generic gaze estimation PoR, X, represented with two co-ordinates, which are passed along with the target location into the Calibrated Gaze Model (CGM), which predicts the calibrated gaze PoR, Y, as described in Equations (1)–(3), for multiple frames.
The calibrated gaze matrix and generic gaze matrix are given as follows:
where and are the NLGEM gaze estimation vectors in the horizontal and the vertical axes, respectively, and and are the CGM calibrated gaze estimation vectors in the horizontal and vertical axes, respectively.
For each of N known stimulus target points, a group of calibrated point matrices and their corresponding NLGEM generic gaze estimation matrices are extracted, and the calibrated gaze vector is approximated by solving a regression problem defined according to the following equations.
where and are second-order polynomial regression functions [31,32,33] of the following forms:
Hence, for each calibration point , with corresponding NLGEM generic gaze estimation matrix , the optimal (least error) coefficients and are calculated and further used within the test sequences for ongoing calibration within the examination sequence. This procedure is repeatedly performed during the examination, allowing for supervised learning of the coefficients that may vary between individual subjects, physical setup, and environmental conditions.
2.2. Validation Experiment
The NLGEM and the combination of NLGEM and CGM were validated by comparing the video-based gaze detection results with those of a specialized IR eye tracker (Tobii, Sweden [23]). IR eye tracker and video data were collected from 25 healthy subjects, who were randomly selected from a large cohort of healthy subjects [30].
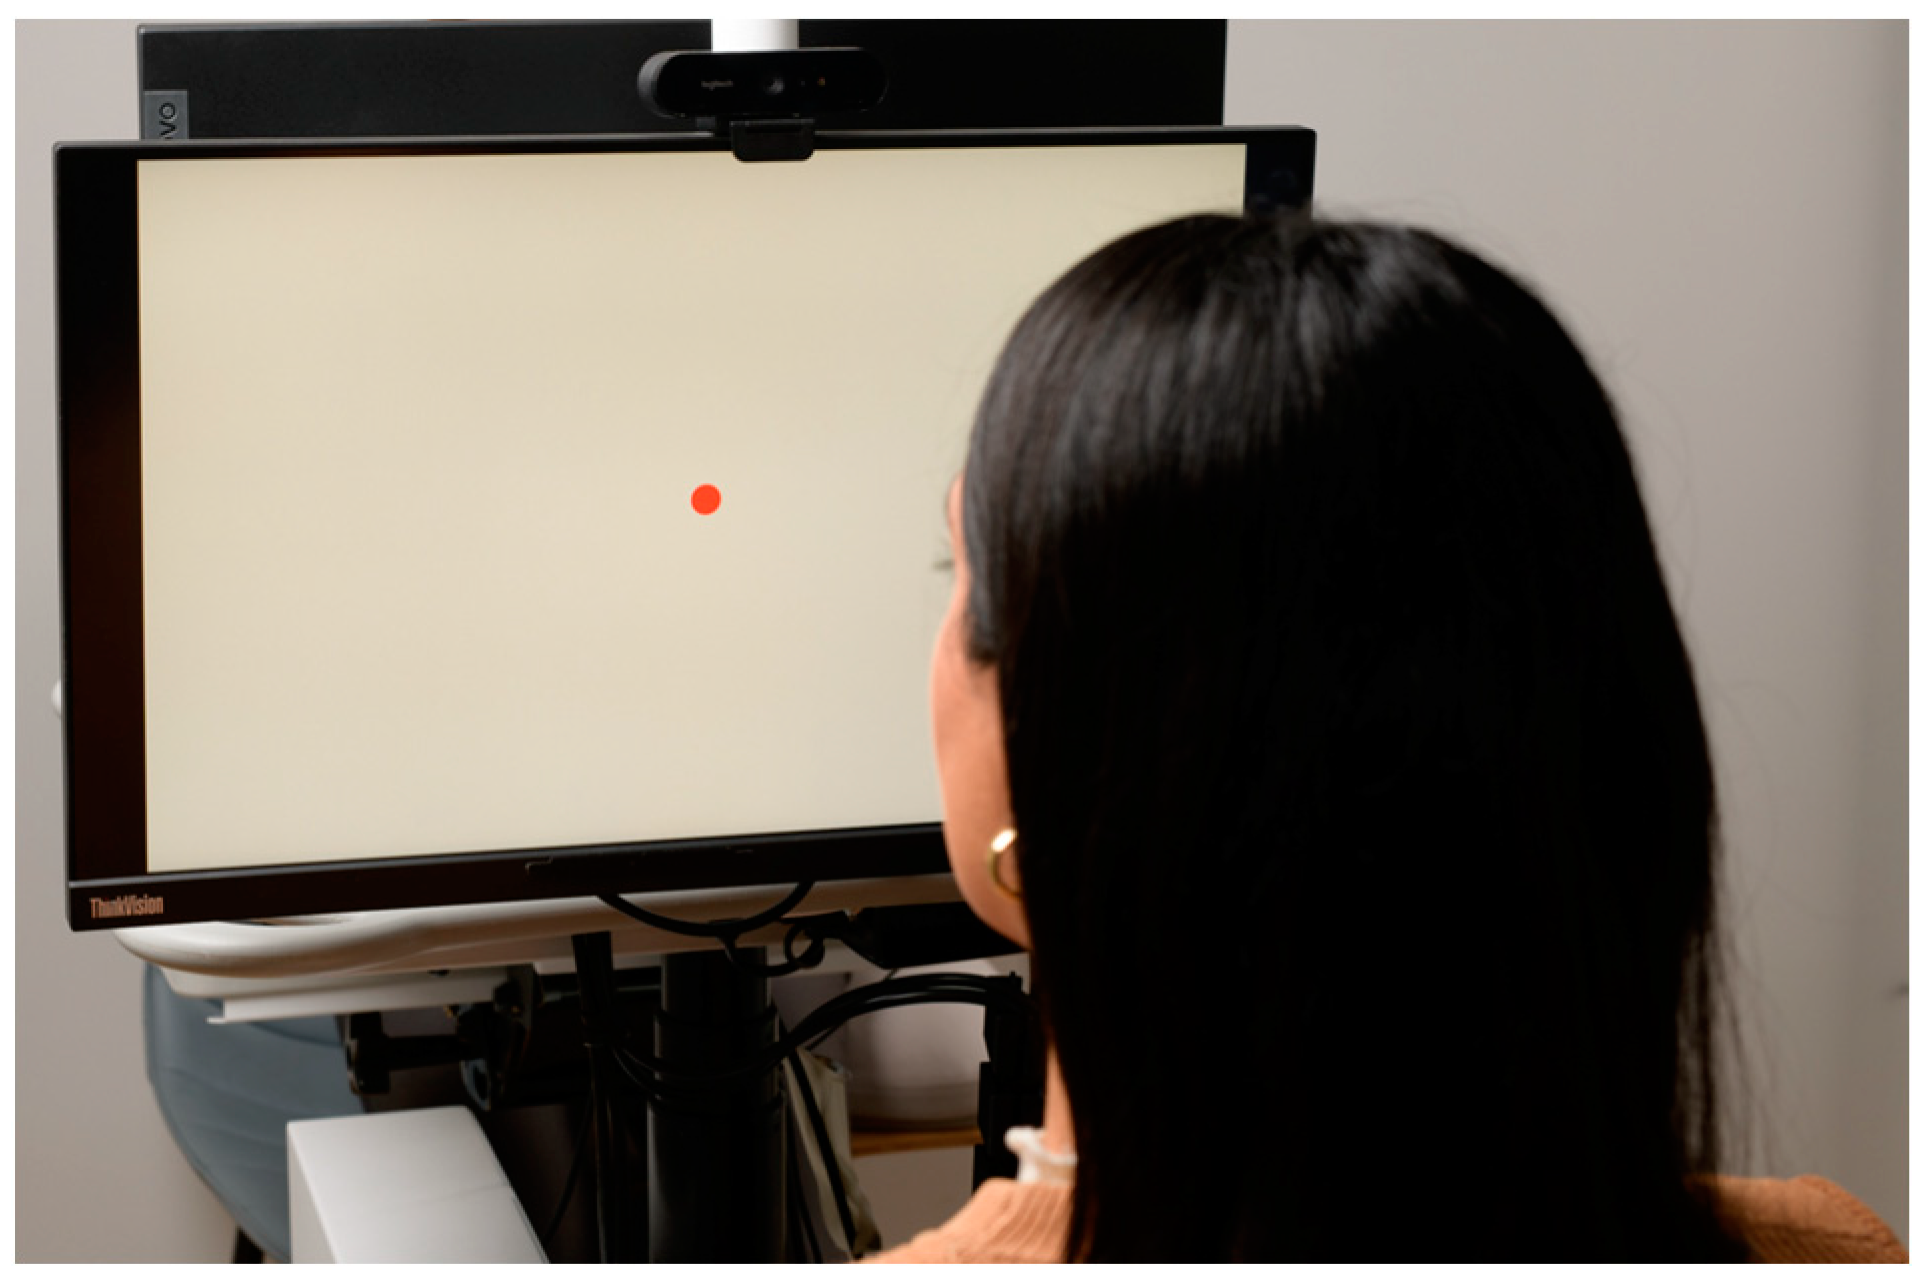
The validation cohort included 259 subjects: 159 females and 100 males aged 19–86 years, with a mean age of 64 years and a standard deviation of 14 years. A total of 128 of the 259 subjects wore corrective glasses during the test (see Table 1). During the data collection sessions, the subjects sat in front of a monitor, at an approximate distance of 50–70 cm (see Figure 3), and were instructed to complete a set of tasks that included horizontal and vertical reflexive pro-saccades.
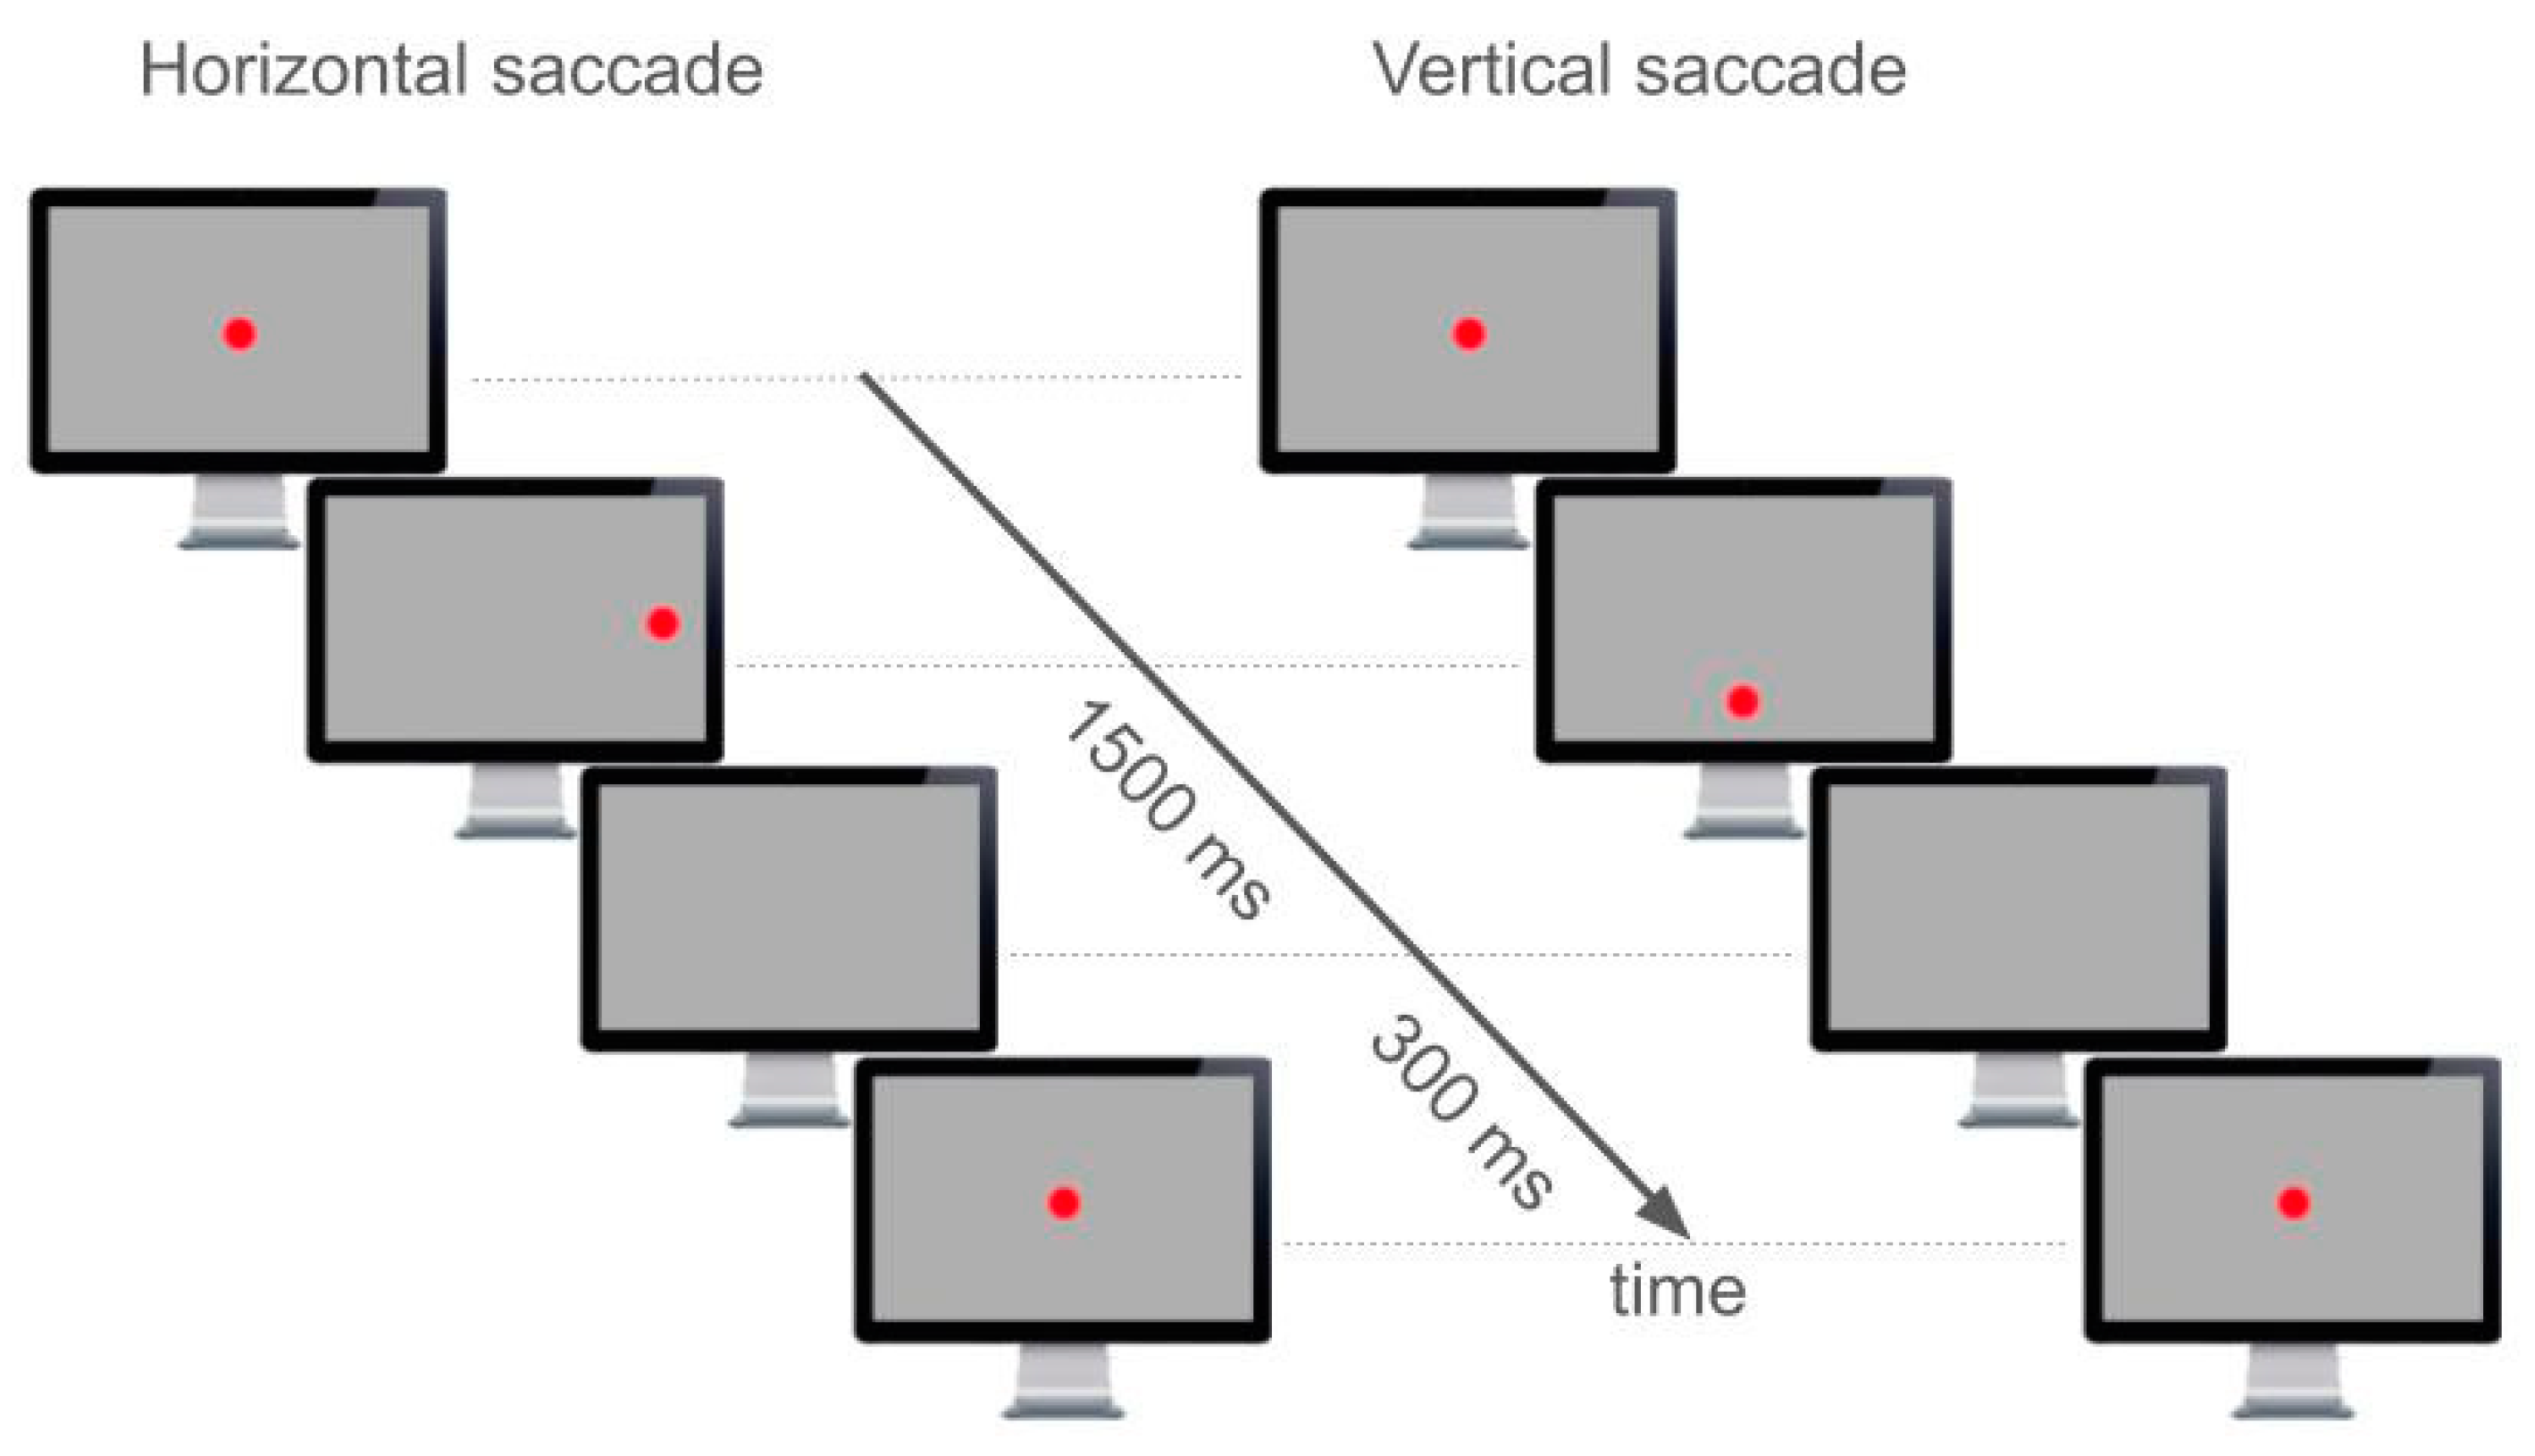
During the pro-saccade task session, the subjects were directed to stare at a red dot when it was presented. The dot appeared at the center of the screen for some (random) time, then immediately disappeared from the screen center and appeared at an angular distance of ~20 degrees or ~13.5 degrees for horizontal or vertical prosaccades, respectively. The dot stayed at its displaced location for 1500 ms and then disappeared. After another 300 ms, where no dot was displayed on the monitor, the central dot reappeared for the next repetition (see Figure 4).
All tasks were performed on a 1920 × 1080 pixel (52.8 cm × 29.7 cm) monitor presenting a uniform grey background, with a 1.38 cm diameter red circle as the gaze target, representing a target whose angular size (from the subject’s location) was degrees. The tests included six 60-s sessions, each containing several pro-saccade stimuli. A break of 30 s was given between the sessions.
While the test sessions were performed, all video and IR eye tracker data were collected using an Apple Mac Mini computer (Apple, designed in Cupertino, CA, USA; manufactured in Malaysia). The stimulus monitor and the webcam timestamps were synchronized, and the data were stored in cloud storage in compliance with HIPAA restrictions. The analysis and preprocessing of data were conducted on an AWS EC2 compute-optimized instance, and the NLGEM training was run on an AWS EC2 gpu-ml-GPU-ML-optimized instance. The Tobii Pro Fusion eye tracker was operated using the Tobii Pro SDK software version 1.9.0 (https://www.tobii.com/products/software/applications-and-developer-kits/tobii-pro-sdk, Tobii, Danderyd, Sweden). The system captured the IR eye tracker gaze data at a sampling rate of 120 Hz and the video stream was captured at 60 frames per second.
3. Results
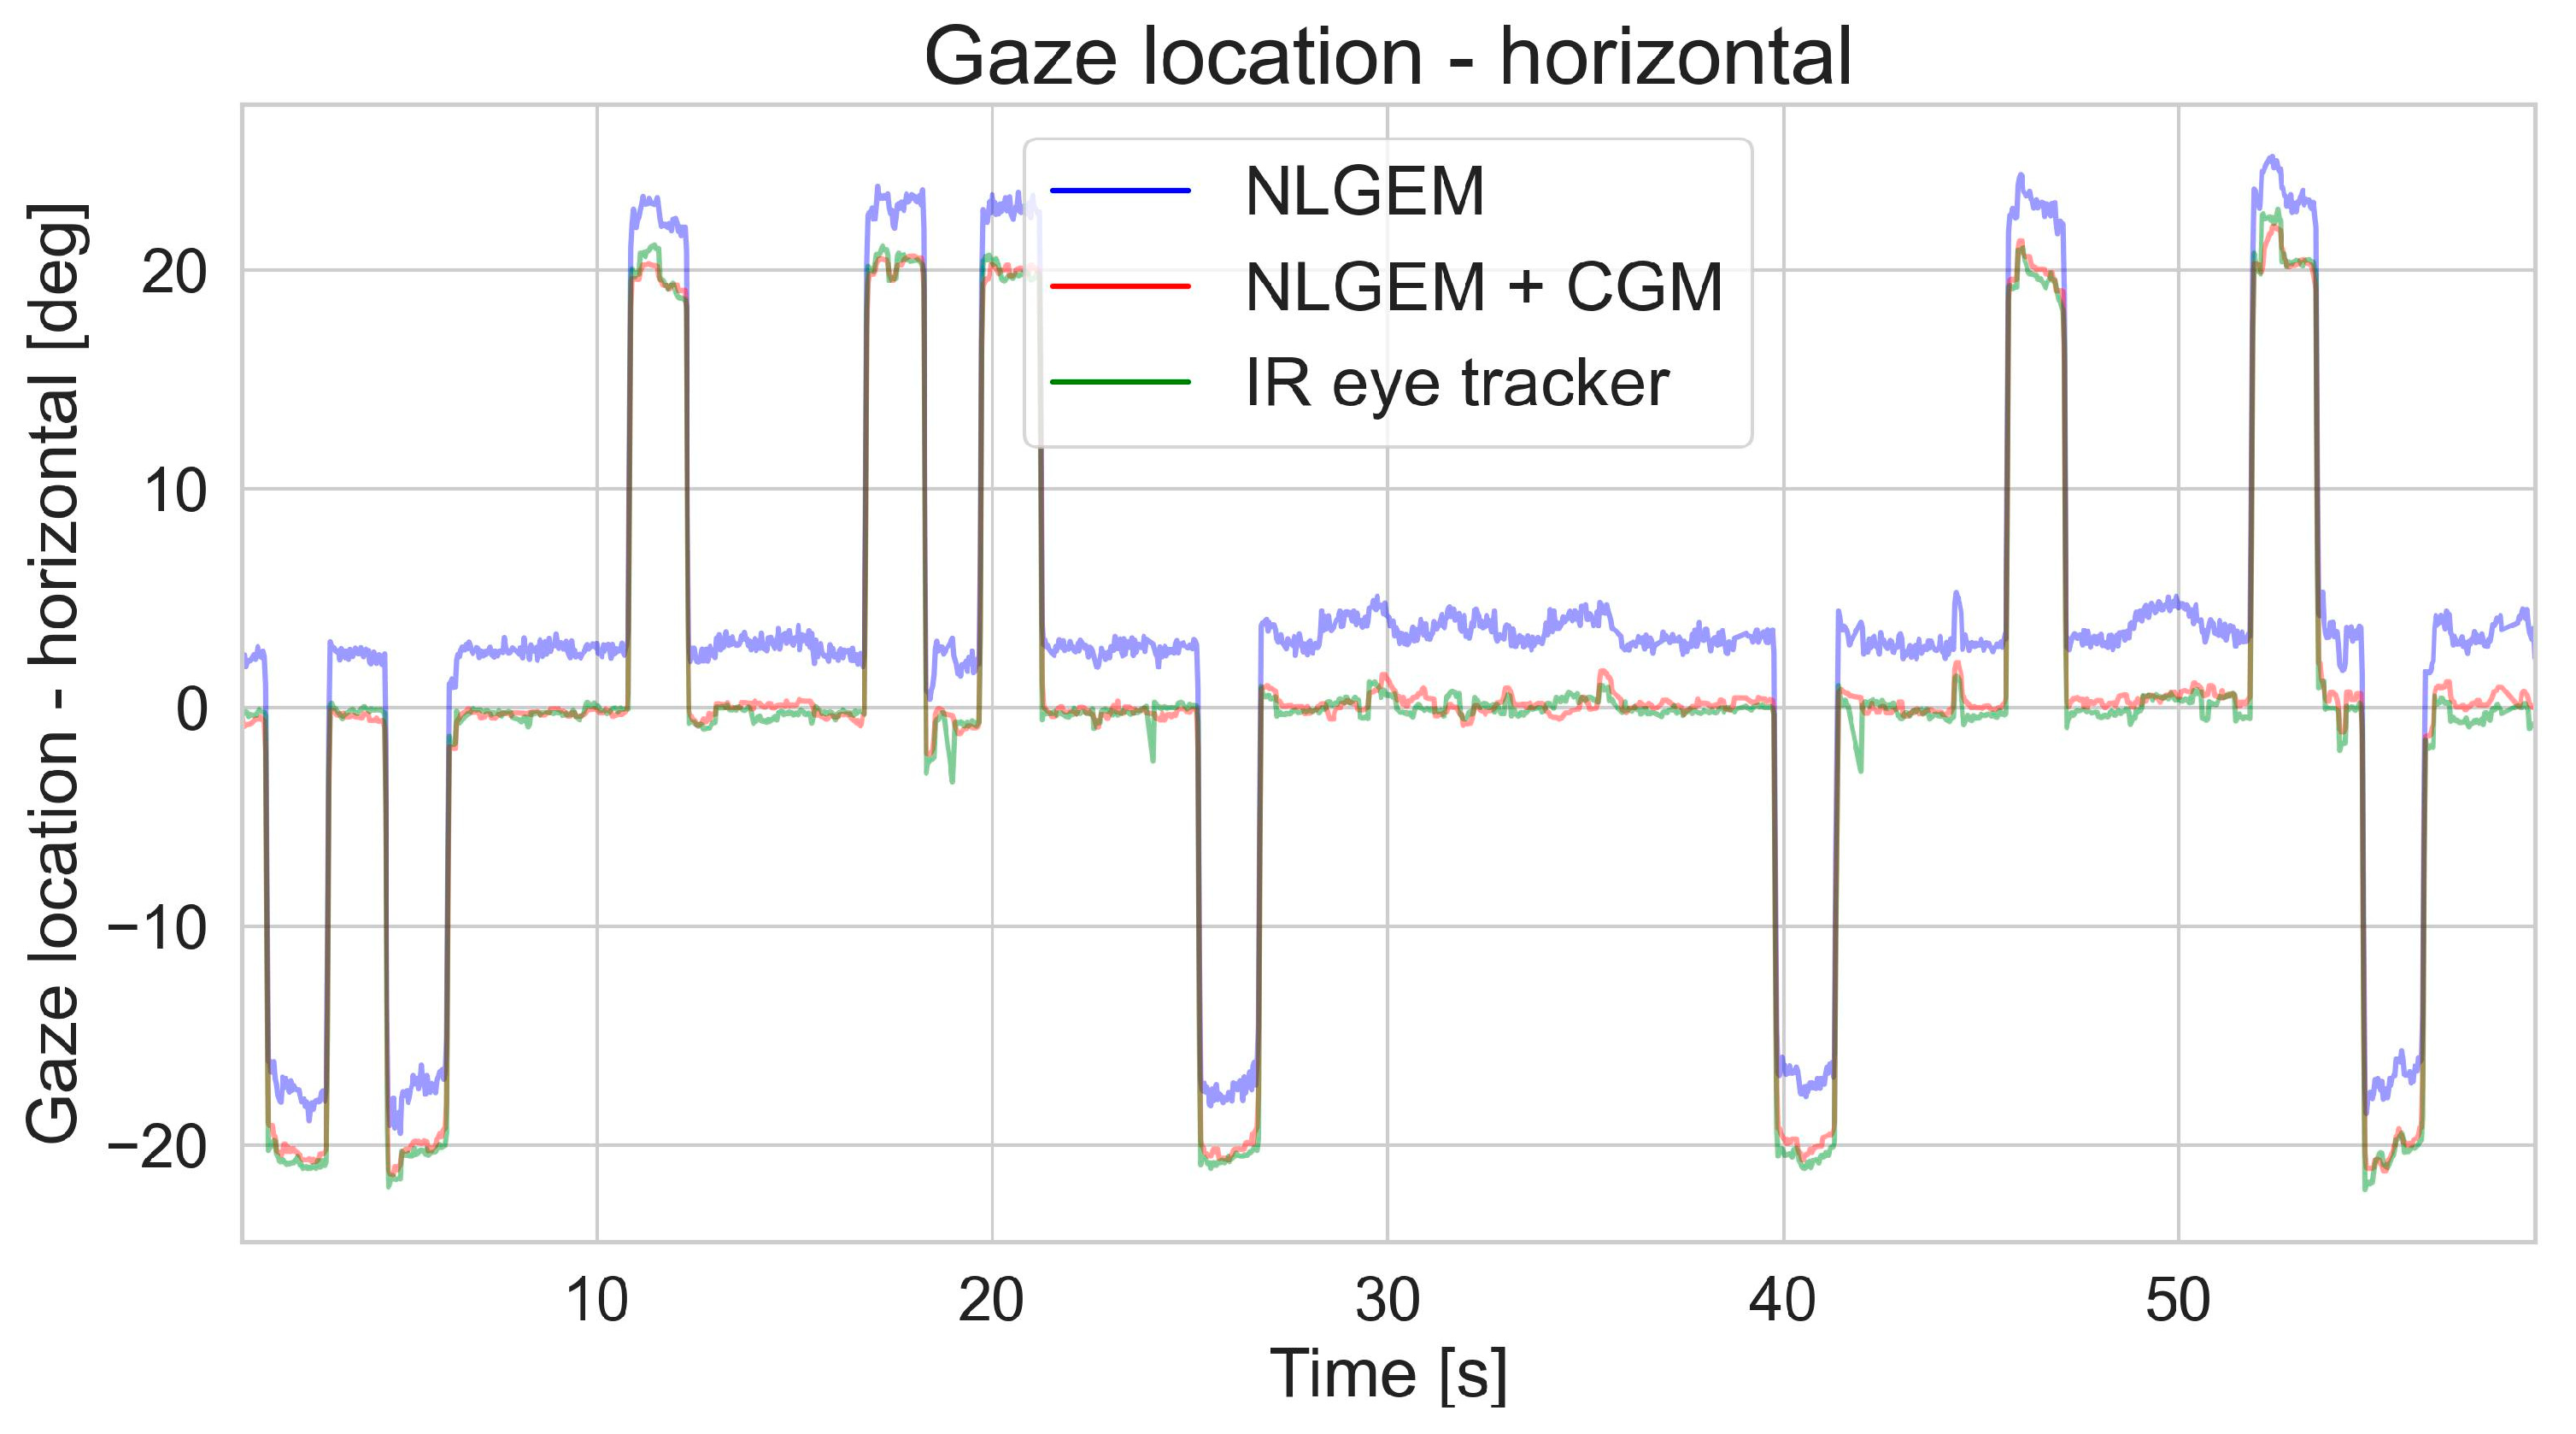
A total of 469 test sessions of horizontal and vertical pro-saccades were analyzed and validated, for a total of 14,768,320 sample frames. Simple qualitative time-series analyses, as shown in Figure 5, clearly demonstrate the improvement in gaze detection accuracy when the CGM was utilized on top of the NLGEM. While the saccade timing (step function in time) was distinctive in both video-based retrievals, the NLGEM + CGM output was much closer to that of the reference IR eye tracker.
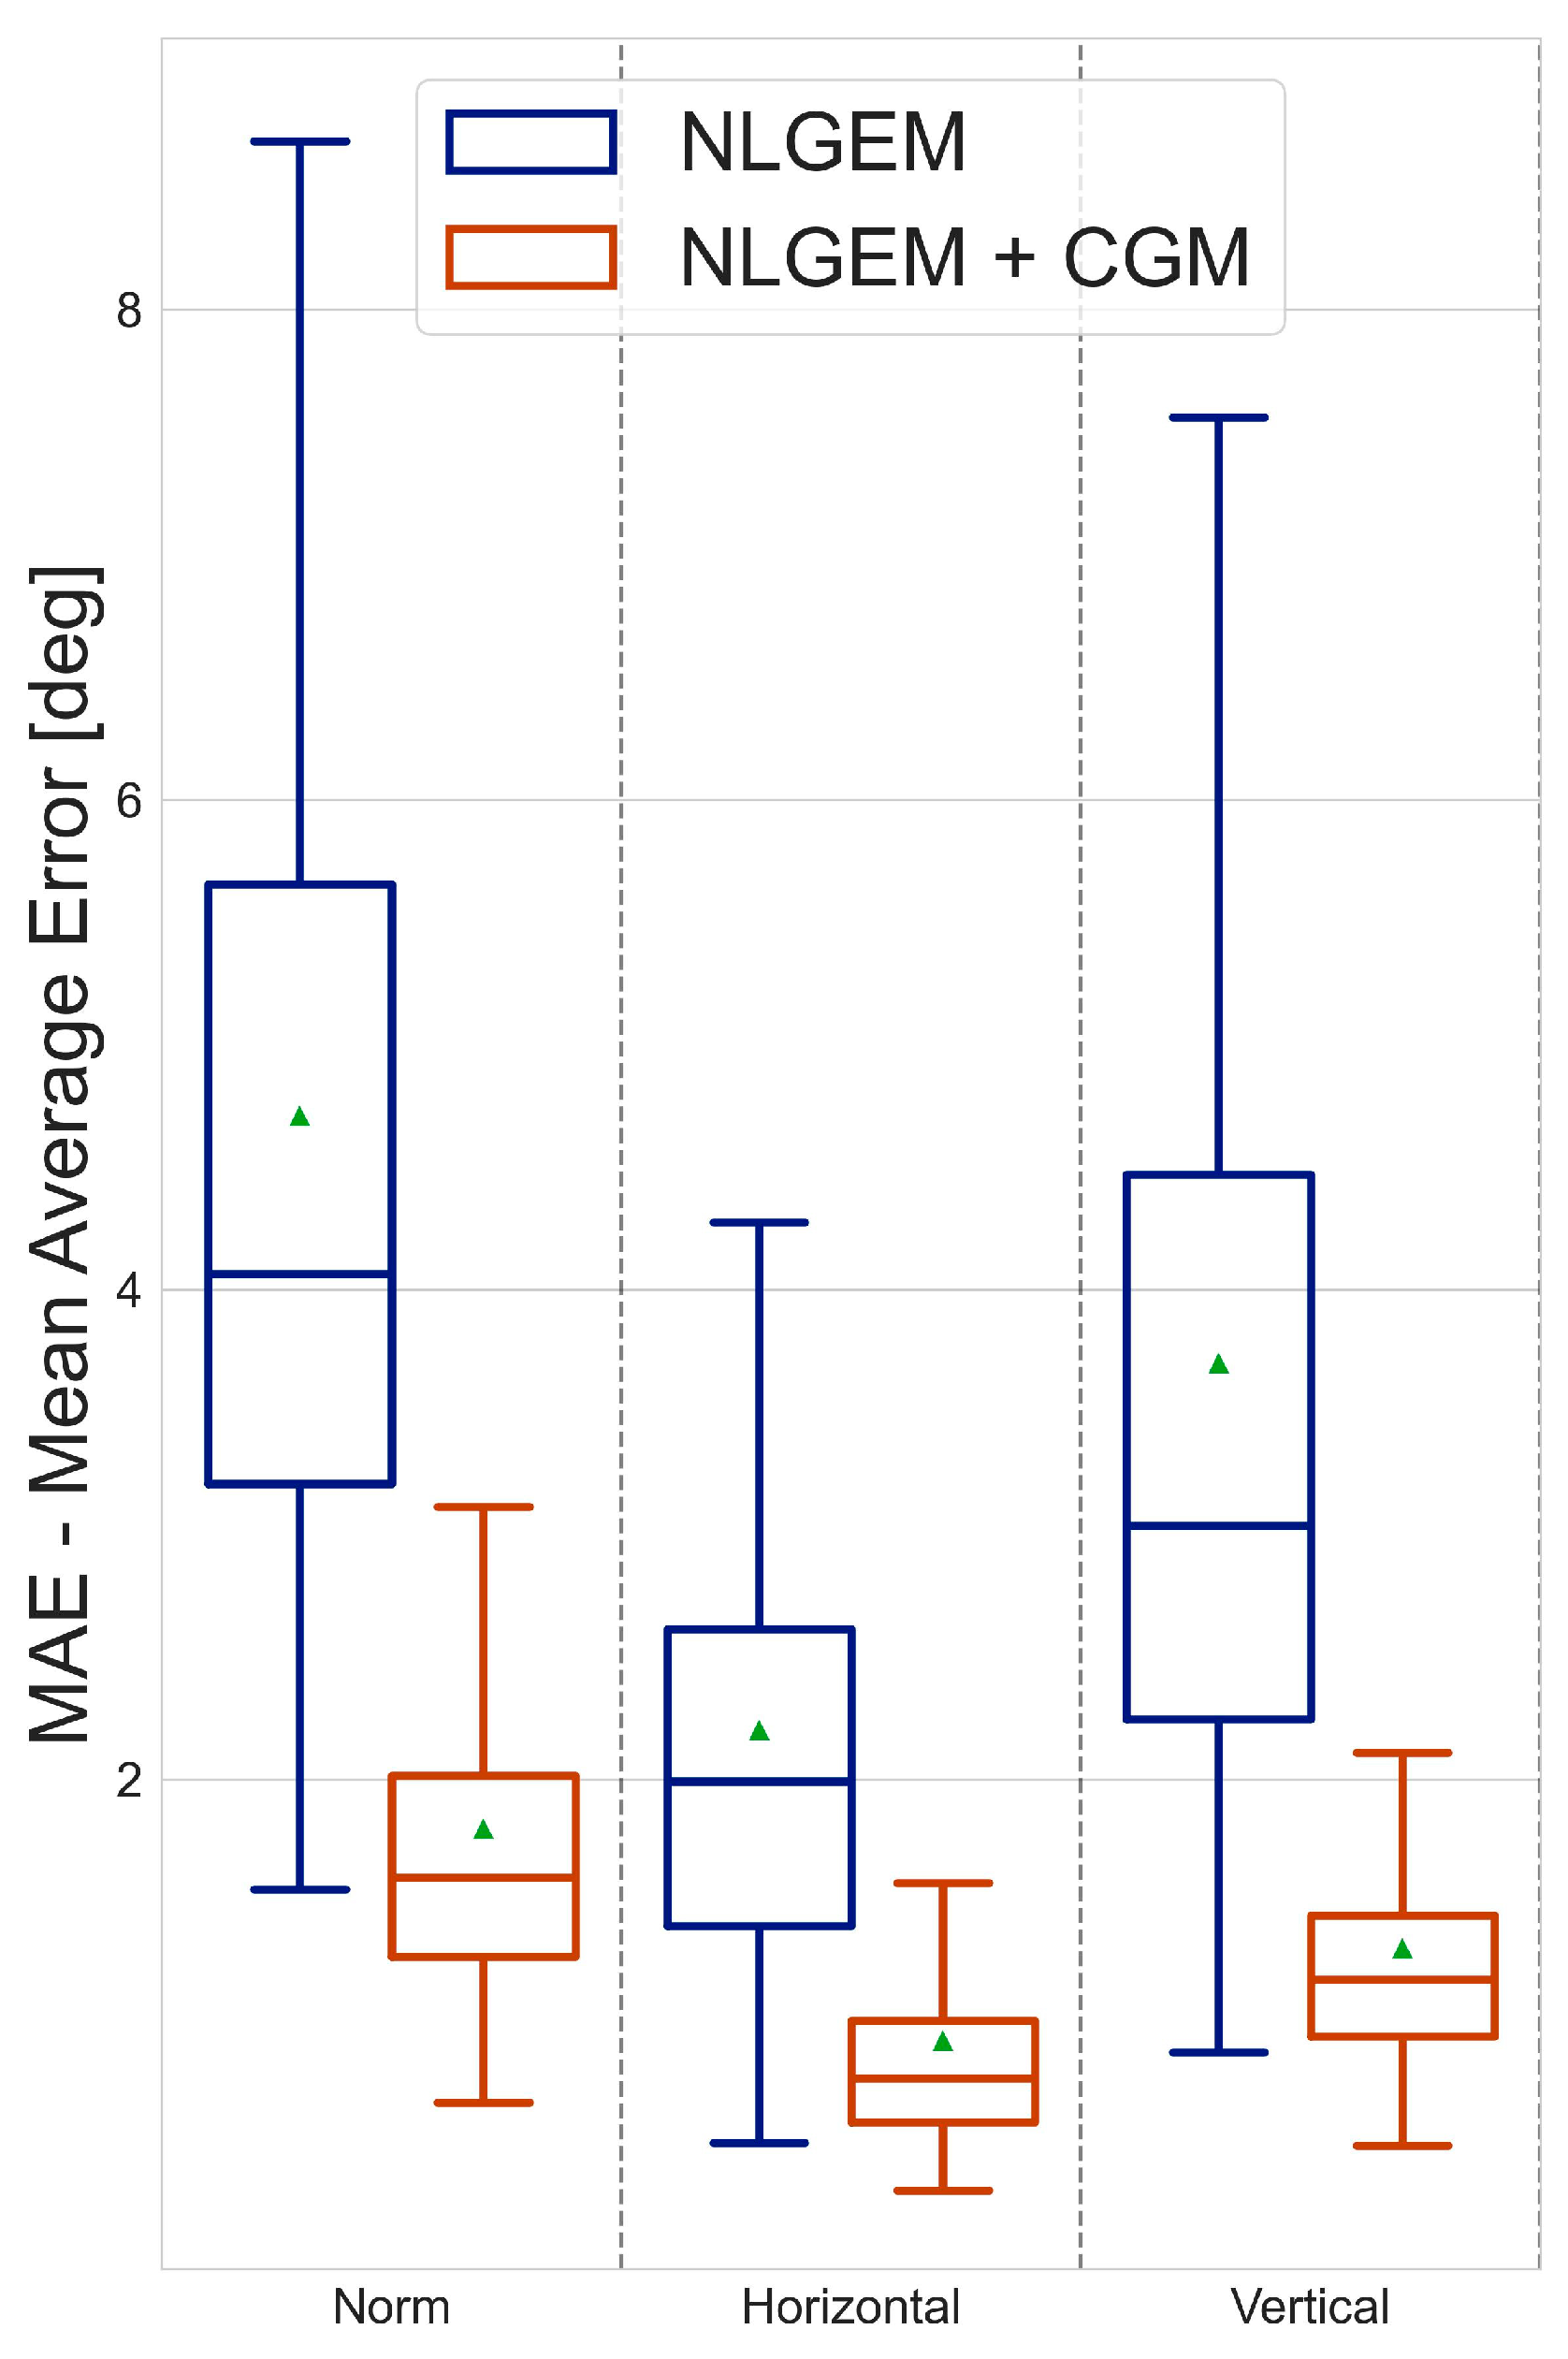
Further quantitative analyses with reference to the IR eye tracker showed that, while the mean absolute error (MAE) of the estimated gaze with the NLGEM itself was 4.71 degrees, the CGM decreased the MAE to 1.80 degrees. This indicates that adding the CGM improved the accuracy by a factor of 2.5, reducing the MAE by 62%. An interesting and distinctive difference was observed between the accuracy levels for the horizontal and vertical gaze detections. Adding the CGM reduced the MAE in the horizontal axis by 58% and in the vertical axis by 65%, achieving MAE values of 0.93 degrees and 1.31 degrees, respectively (see Table 2). When comparing the MAE distributions of the gaze detection based on the two models, we found a significantly narrower MAE distribution when the CGM was applied after the NLGEM, allowing better confidence when aggregating multiple samples (see Figure 6).
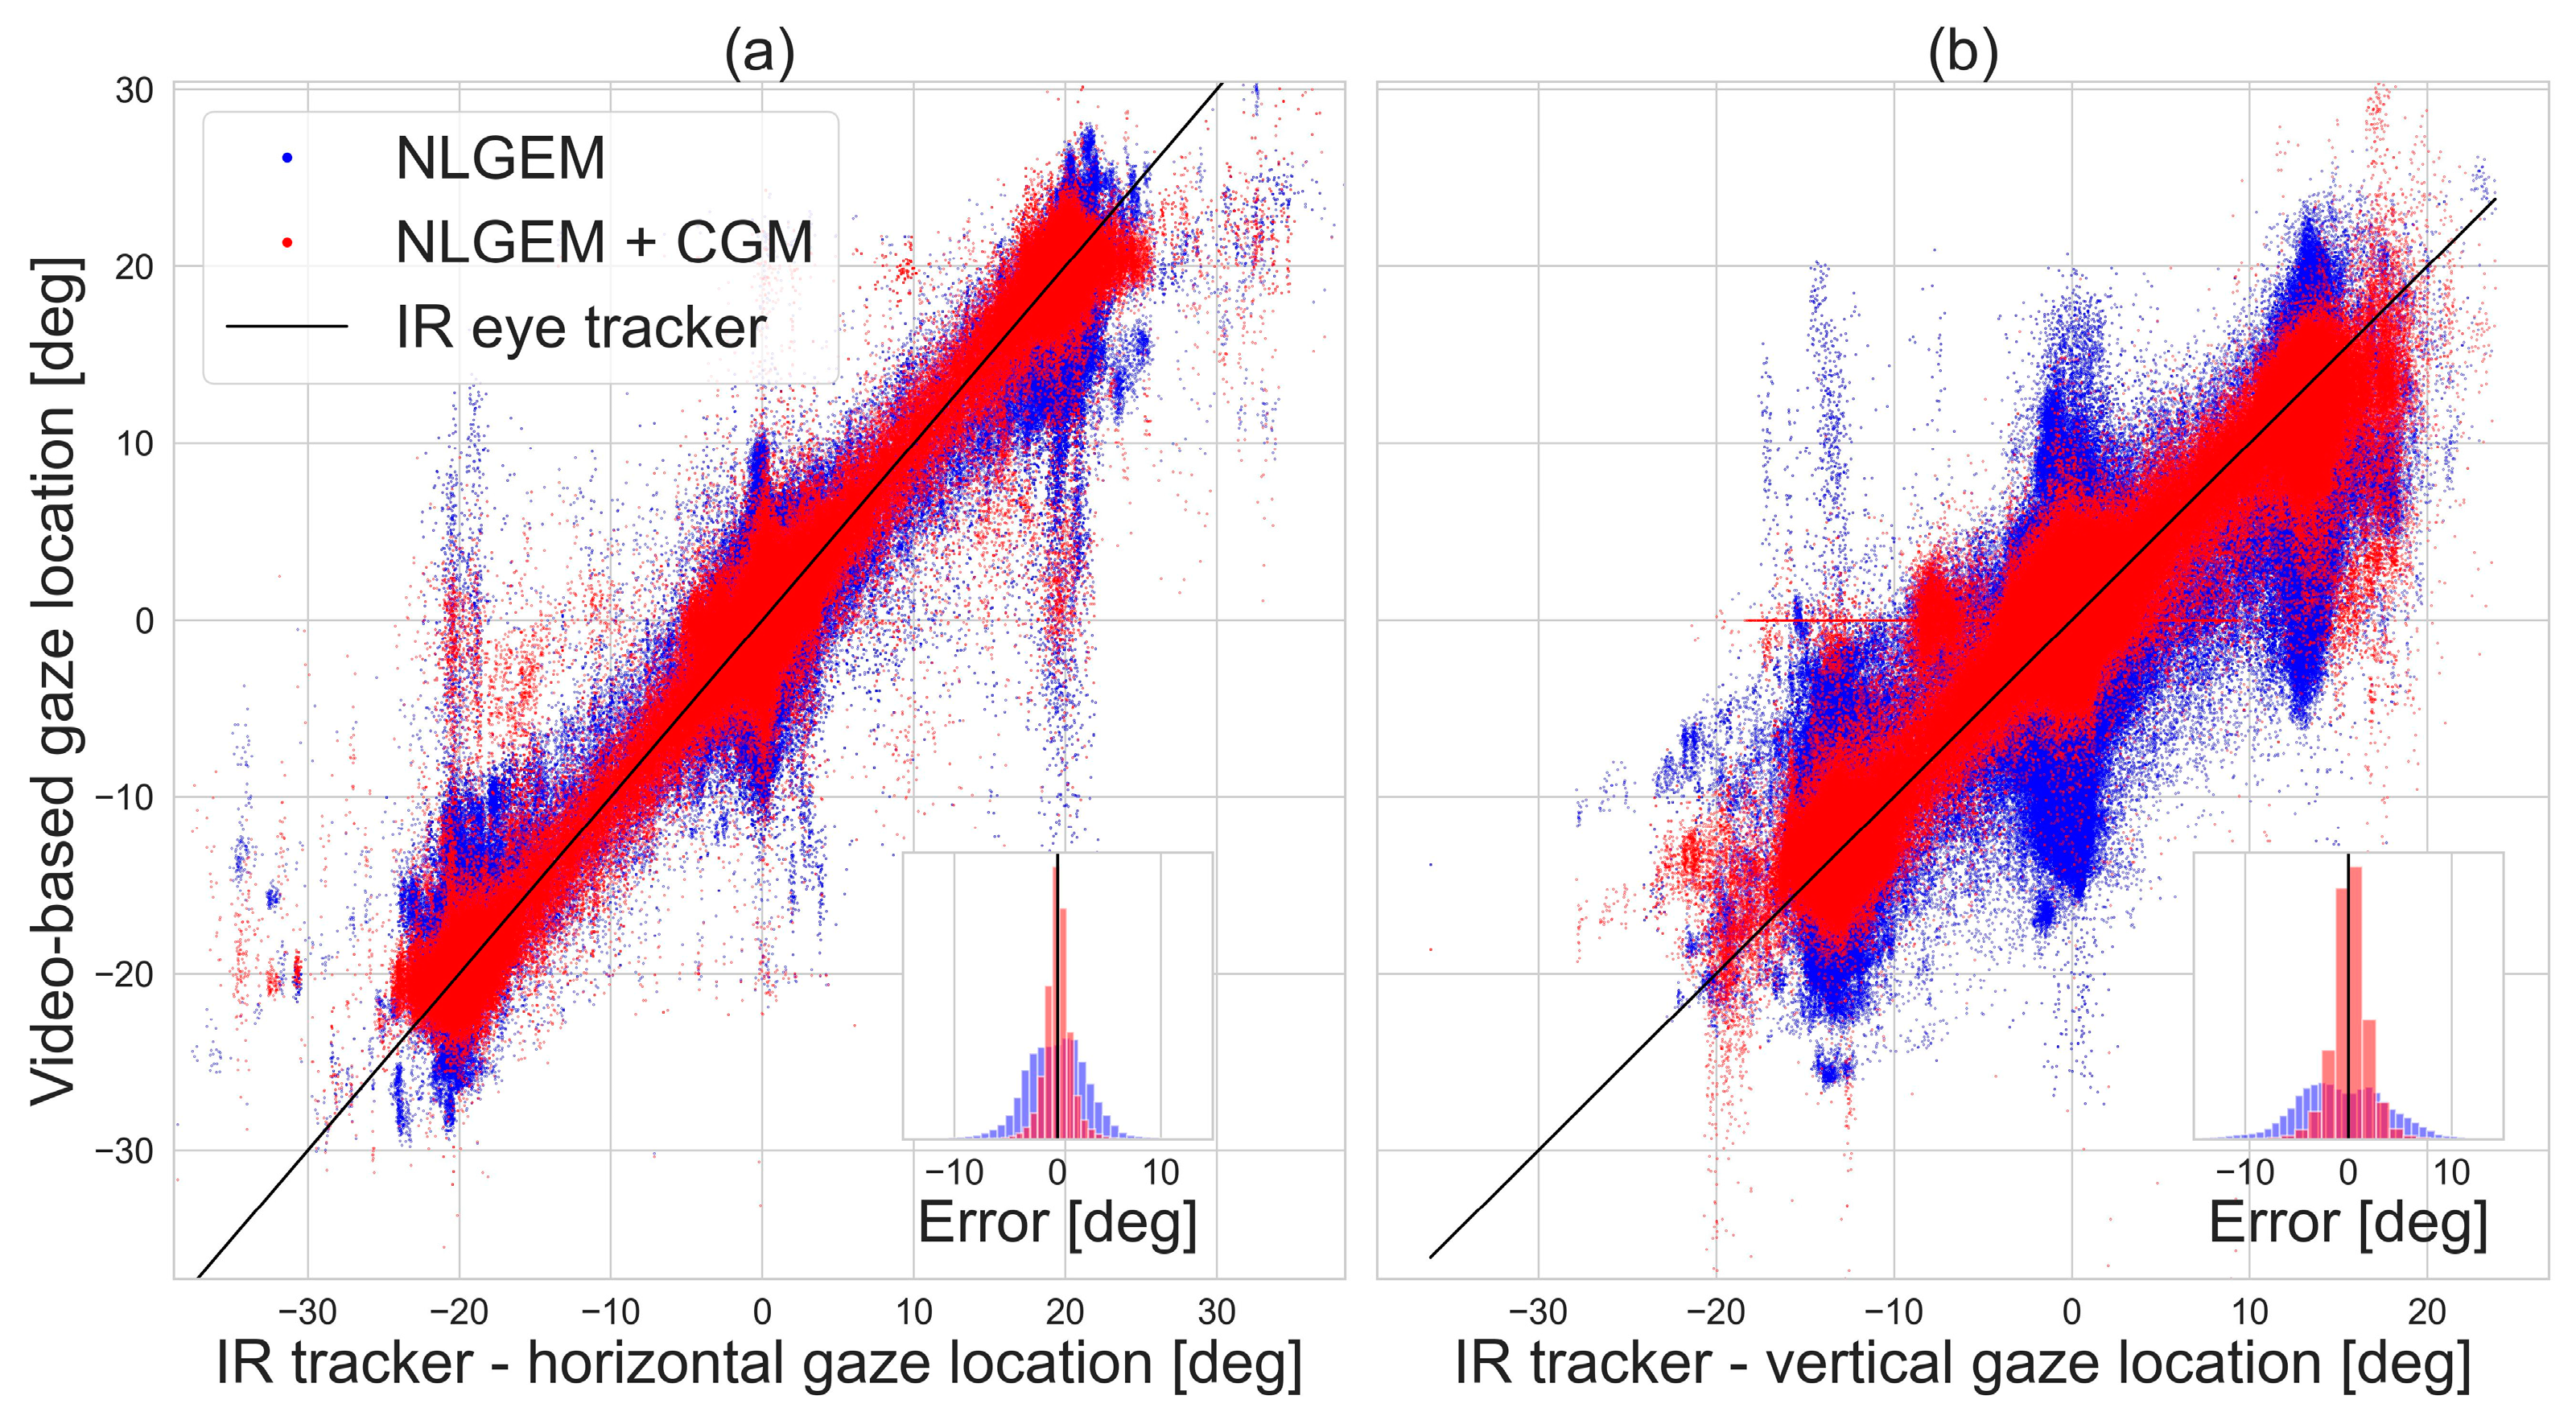
A closer look at the error distributions of the vertical and horizontal gaze locations provided by the video-based gaze estimation models (see Figure 7) revealed that the CGM significantly improved the error distribution symmetry, in addition to the MAE values. While the error distribution of the NLGEM estimated gaze locations seemed to be multimodal and to vary with different PoR locations, after the CGM was utilized, the gaze estimation error was characterized by a narrow modal distribution.
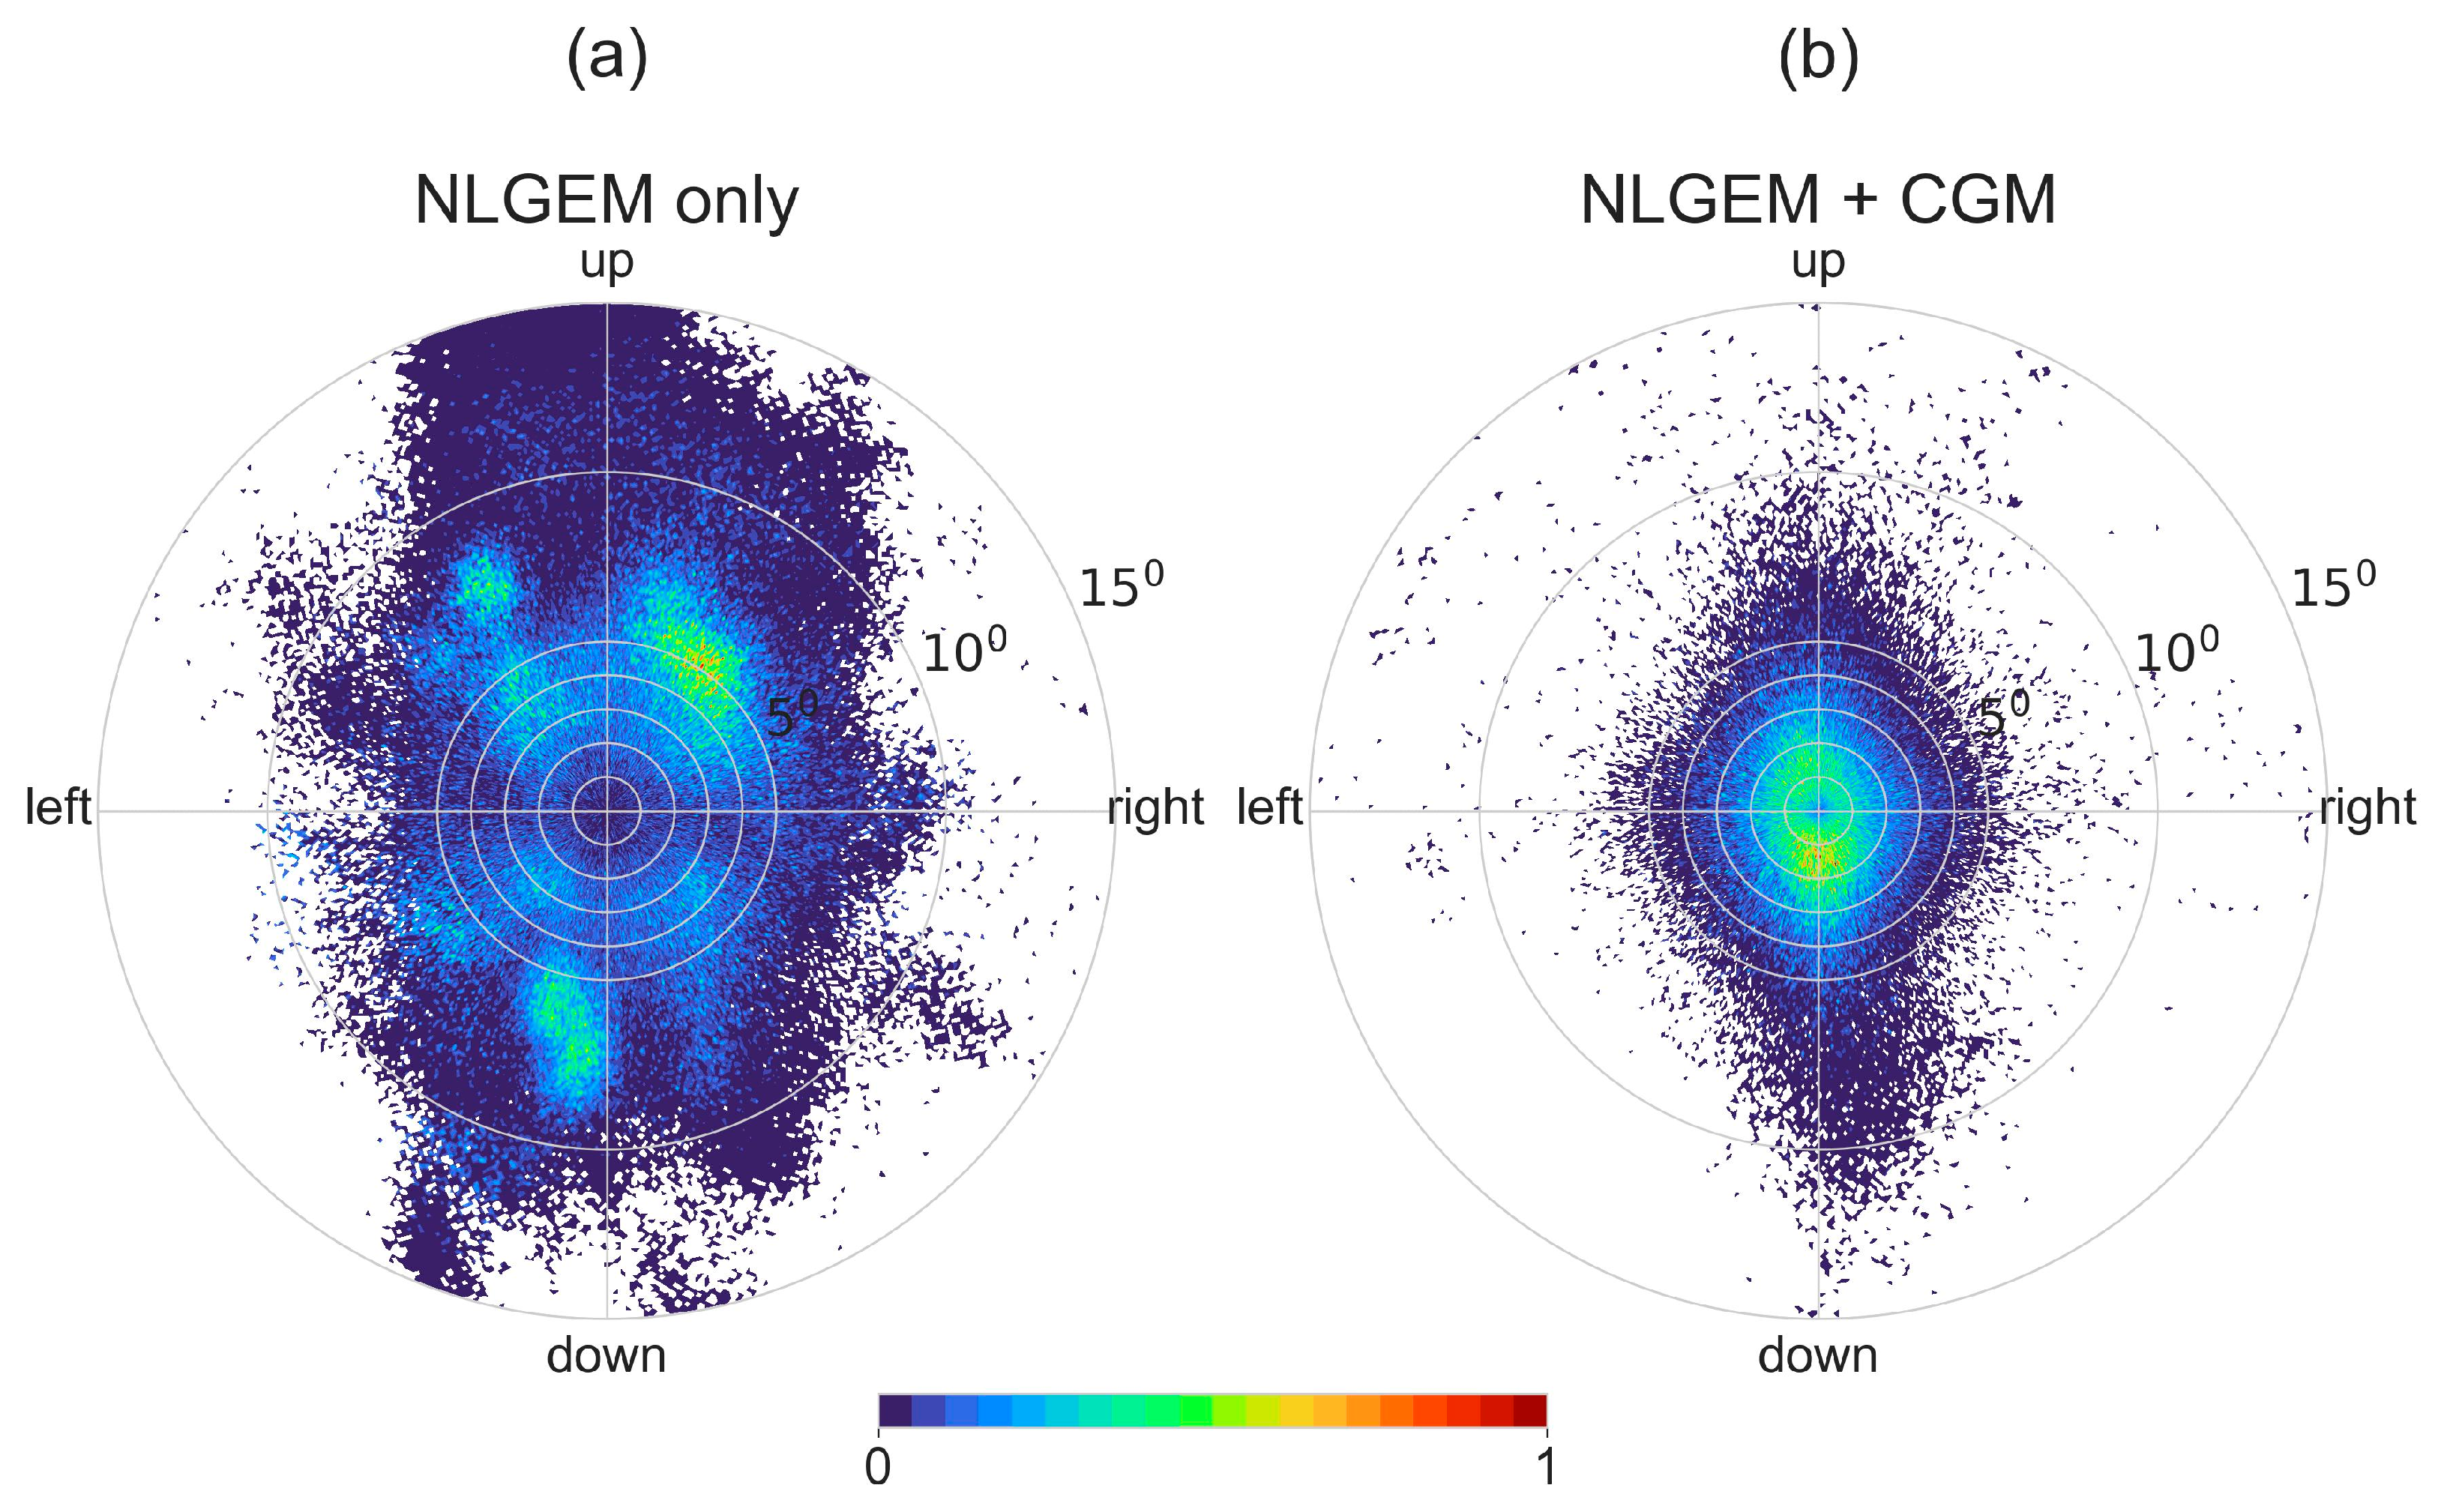
The gaze spatial error was calculated as the distance vector between the estimated gaze location and the reference (i.e., the IR eye tracker, in this case). Figure 8 presents the 2D gaze spatial error distribution when implementing NLGEM alone (Figure 8a) and when adding the CGM calculation (Figure 8b), exposing the spatial features of the gaze errors. The gaze estimations produced using the NLGEM were widely distributed in various directions and were characterized by an amorphous pattern whose local maxima were in random locations. This unstructured, clustered distribution may have resulted from biases depending on the individual subjects; for instance, glass lenses may bias passive imaging sensors but would not affect active sensors, such as the IR eye tracker used as a reference in this study.
Introducing the stimuli target locations and using the CGM in addition to the NLGEM gaze estimations significantly improved the spatial error (Figure 8b). After implementing the CGM, the spatial error pattern was symmetric and centered on the origin, as expected from a calibrated sensor with a normally distributed measurement error.
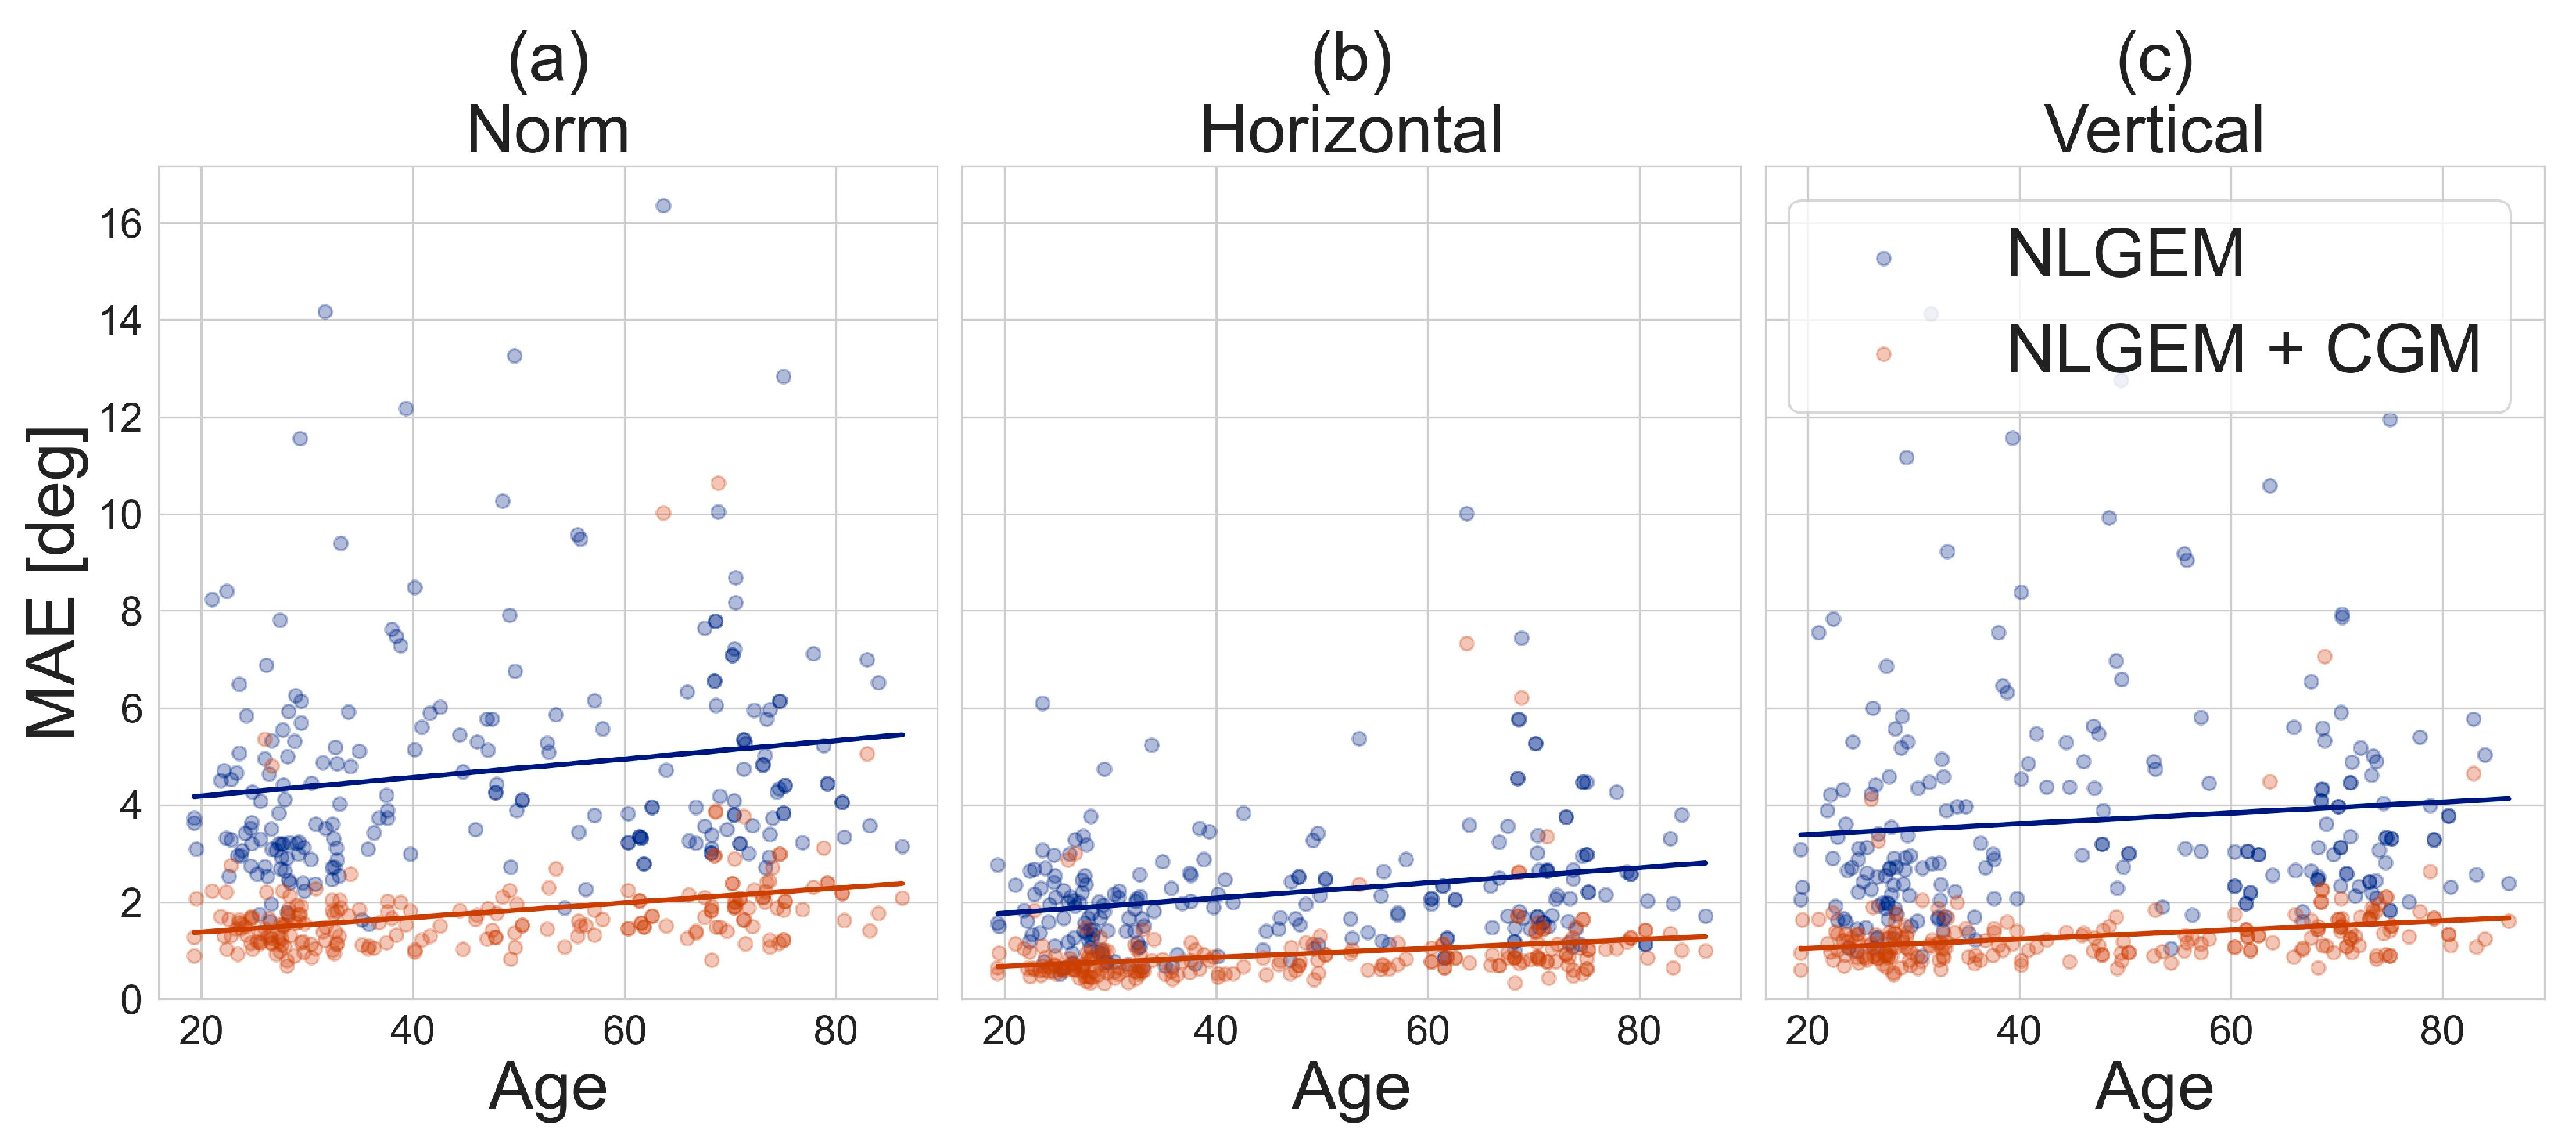
Additional analysis on the validation cohort results was conducted to estimate the contribution of the CGM to sensitivity to the age of patients, as shown in Figure 9. While the significant advantage of the NLGEM + CGM over the NLGEM was maintained along all patient ages, the MAE for both NLGEM alone and NLGEM + CGM gaze estimation increased with age, at a mean pace of .
4. Discussion
In this study, we introduced a video-based gaze detection model, comprising an independent video-based NeuraLight Gaze Estimation Model (NLGEM) and an additional Calibrated Gaze Model (CGM), which uses the target locations of visual stimuli for ongoing real-time calibration during test sessions. The NLGEM model architecture is based on recently published works (Figure 2) [28], with the exception of training the model on labels measured using an IR tracker and the recruitment of a dedicated cohort for the training and test sets. For validation, we tested our gaze detection model on an independent cohort of 259 participants (see Table 1) who performed horizontal and vertical pro-saccade tasks while sitting at a distance of approximately 60 cm from a display, with no head restraint.
Compared to the use of a specialized IR eye tracker as a reference ground truth, we found that the NLGEM alone achieved an absolute visual angle accuracy (MAE) of 4.80 degrees. While such an accuracy level is comparable to that of some of the leading IR eye trackers available at present [23,24] and may be sufficient for applications that require general visual attention direction or saliency distribution on display, most eye tracking applications require higher accuracy, especially in medical applications (e.g., for the measurement of eye movements in patients with various diseases and oculomotor symptoms).
Most abnormal oculometric measures (OMs) that are present in patients are based on measuring eye movements in response to visual stimulation tasks. Therefore, we added the CGM on top of the NLGEM to leverage the information provided by the visual stimuli, namely the target location. When testing the performance of NLGEM and CGM together (NLGEM + CGM), we achieved an absolute gaze detection accuracy (MAE) of 1.80 degrees in the norm, as well as an MAE of 0.93 degrees in the horizontal direction and 1.31 degrees vertically, as detailed in Table 2. When aiming to measure eye movements, the separation into horizontal and vertical directions is required as, in some movements (e.g., saccades), horizontal and vertical movements involve different pathways [11]. Therefore, the accuracy estimations in this work for the horizontal and vertical axes are useful when assessing OMs based on mechanisms that depend on the movement direction.
The performance of the NLGEM + CGM approach was within the systematic errors of the Tobii Pro Fusion eye tracker (0.3 degrees) when taking into consideration the stimuli target size, which was . Given the accuracy level of our reference measurement (Tobii, 0.3 degrees) and the size of the target displayed (~1.35 degrees), we suggest that our gaze detection model accuracy fulfils the requirements of various OM extraction applications, such as measuring oculomotor abnormalities in patients with different diseases, using only a retail-grade webcam and without the need to fix the subject’s head. With the used video sample rate of 60 frames per second, the maximal error in time for a single sample is 16.6 ms, allowing for the confident detection of abnormalities in OMs, whose time scale is ~100 ms and whose visual angle scale is larger than our calculated errors (e.g., the Square Wave Jerks [34] rate, Saccadic Latency, Saccadic Amplitude, Saccadic Error Rate, and so on).
The impact of age on our video-based gaze detection models was estimated according to an increase in the MAE with the age of the patient, presenting an average rate of . The increase in the gaze estimation MAE with age was similar for the NLGEM and NLGEM + CGM models, as well as in all direction variances examined. The increasing uncertainty in video-based eye tracking with age can be influenced by the effects of aging on the physiology and structure of the eye [35]; for instance, changes in pupil size, lens elasticity, and retinal function may lead to higher variability in these landmarks in aged populations, leading to a continuously increasing error in video-based gaze estimation.
Recent video-based gaze detection models have presented high levels of accuracy for free-head visual stimulation tasks within the range of 2–5 degrees [36,37,38]. The model introduced in this study yielded better performance under similar experimental settings. Furthermore, unlike the model presented here, all recent studies have mentioned the requirement of a separate dedicated calibration task for each test. The CGM module in our work eliminates the need for this separate calibration task, instead enabling ongoing real-time calibration during the test. The combination of high-accuracy gaze estimation and flexible environmental settings provides new opportunities for advances in the oculometric measurement analysis of patients with various diseases affecting their oculomotor skills, resulting in eye movement abnormalities.
Furthermore, with the capabilities demonstrated in this study, relevant oculometric measures could be extracted and measured easily using a clinical setup, or even remotely in the patient’s home, assuming that they have access to a computer equipped with a web camera. The ease of operating these applications would increase the number of examined patients, extending the training set of our models and, hence, their accuracy. An accurate, affordable, and accessible medical standard OM extraction tool may lead to significant scientific progress and potential for many patients who strive for a better diagnosis and monitoring of their disease progress.
Author Contributions
Conceptualization, E.H., I.R., R.Z.B.-O. and E.B.-A.; methodology, E.H.; software, E.H. and I.R.; validation, E.H. and R.Z.B.-O.; formal analysis, R.Z.B.-O.; investigation, E.H.; resources, E.H. and E.B.-A.; data curation, E.H. and E.B.-A.; writing—original draft preparation, R.Z.B.-O.; writing—review and editing, R.Z.B.-O., E.H. and E.B.-A.; visualization, R.Z.B.-O.; supervision, E.H.; project administration, E.B.-A.; funding acquisition, E.B.-A. All authors have read and agreed to the published version of the manuscript.
Funding
This study was fully funded by NeuraLight Ltd.
Institutional Review Board Statement
This study was approved (22 July 2022) by an independent ethics committee (WCG IRB, Puyallup, WA, USA, protocol number HDC/2022-3) and adhered to the tenets of the Declaration of Helsinki.
Informed Consent Statement
Informed consent was obtained from all subjects involved in the study prior to study entry.
Data Availability Statement
Publicly available datasets were analyzed in this study. This data can be found here: https://github.com/Bar-Or/NLGEM_CGM_Gaze.
Acknowledgments
The authors would like to gratefully acknowledge the NeuraLight clinical team and NeuraLight research team. The authors would like to express further gratitude to all healthy subjects who participated in this study.
Conflicts of Interest
E.H., R.Z.B.-O., I.R. and E.B.-A. are employees of NeuraLight. The authors declare that this study received funding from NeuraLight Ltd. The funder had the following involvement with the study: NeuraLight Ltd. has funded the entire operational environment for this study, including examination rooms, software platform, equipment, office supply, data analysis and publication costs.
References
- Jacob, R.J.K.; Karn, K.S. Eye Tracking in Human-Computer Interaction and Usability Research. In The Mind’s Eye; Elsevier: Amsterdam, The Netherlands, 2003; pp. 573–605. ISBN 978-0-444-51020-4. [Google Scholar]
- Cazzato, D.; Leo, M.; Distante, C.; Voos, H. When I Look into Your Eyes: A Survey on Computer Vision Contributions for Human Gaze Estimation and Tracking. Sensors 2020, 20, 3739. [Google Scholar] [CrossRef]
- Naqvi, R.; Arsalan, M.; Batchuluun, G.; Yoon, H.; Park, K. Deep Learning-Based Gaze Detection System for Automobile Drivers Using a NIR Camera Sensor. Sensors 2018, 18, 456. [Google Scholar] [CrossRef]
- Peißl, S.; Wickens, C.D.; Baruah, R. Eye-Tracking Measures in Aviation: A Selective Literature Review. Int. J. Aerosp. Psychol. 2018, 28, 98–112. [Google Scholar] [CrossRef]
- Atkins, M.S.; Tien, G.; Khan, R.S.A.; Meneghetti, A.; Zheng, B. What Do Surgeons See: Capturing and Synchronizing Eye Gaze for Surgery Applications. Surg. Innov. 2013, 20, 241–248. [Google Scholar] [CrossRef]
- Aggarwal, N.; Saini, B.S.; Gupta, S. The Impact of Clinical Scales in Parkinson’s Disease: A Systematic Review. Egypt. J. Neurol. Psychiatry Neurosurg. 2021, 57, 174. [Google Scholar] [CrossRef]
- Santos, R.D.O.J.D.; Oliveira, J.H.C.D.; Rocha, J.B.; Giraldi, J.D.M.E. Eye Tracking in Neuromarketing: A Research Agenda for Marketing Studies. Int. J. Psychol. Stud. 2015, 7, p32. [Google Scholar] [CrossRef]
- Hoffman, D.L.; Moreau, C.P.; Stremersch, S.; Wedel, M. The Rise of New Technologies in Marketing: A Framework and Outlook. J. Mark. 2022, 86, 1–6. [Google Scholar] [CrossRef]
- Scott, N.; Zhang, R.; Le, D.; Moyle, B. A Review of Eye-Tracking Research in Tourism. Curr. Issues Tour. 2017, 22, 1244–1261. [Google Scholar] [CrossRef]
- Leigh, R.J.; Zee, D.S. The Neurology of Eye Movements, 5th ed.; Oxford University Press: Oxford, UK, 2015; ISBN 978-0-19-996928-9. [Google Scholar]
- Lal, V.; Truong, D. Eye Movement Abnormalities in Movement Disorders. Clin. Park. Relat. Disord. 2019, 1, 54–63. [Google Scholar] [CrossRef]
- Danchaivijitr, C. Diplopia and Eye Movement Disorders. J. Neurol. Neurosurg. Psychiatry 2004, 75, iv24–iv31. [Google Scholar] [CrossRef] [PubMed]
- Johnston, J.L.; Daye, P.M.; Thomson, G.T.D. Inaccurate Saccades and Enhanced Vestibulo-Ocular Reflex Suppression during Combined Eye–Head Movements in Patients with Chronic Neck Pain: Possible Implications for Cervical Vertigo. Front. Neurol. 2017, 8, 23. [Google Scholar] [CrossRef]
- Coric, D.; Nij Bijvank, J.A.; Van Rijn, L.J.; Petzold, A.; Balk, L.J. The Role of Optical Coherence Tomography and Infrared Oculography in Assessing the Visual Pathway and CNS in Multiple Sclerosis. Neurodegener. Dis. Manag. 2018, 8, 323–335. [Google Scholar] [CrossRef]
- Bastien, N.; Chernock, M.; De Villers-Sidani, E.; Voss, P.; Blanchette, F.; Arseneau, F.; Hussein, S.; Ramos, R.; Giacomini, P.S. P.028 Eye Movement Biomarkers for Early Detection of Multiple Sclerosis Disease Progression. Can. J. Neurol. Sci. J. Can. Sci. Neurol. 2022, 49, S15. [Google Scholar] [CrossRef]
- Reiner, J.; Franken, L.; Raveh, E.; Rosset, I.; Kreitman, R.; Ben-Ami, E.; Djaldetti, R. Oculometric Measures as a Tool for Assessment of Clinical Symptoms and Severity of Parkinson’s Disease. J. Neural Transm. 2023, 130, 1241–1248. [Google Scholar] [CrossRef] [PubMed]
- Ba, F.; Sang, T.T.; He, W.; Fatehi, J.; Mostofi, E.; Zheng, B. Stereopsis and Eye Movement Abnormalities in Parkinson’s Disease and Their Clinical Implications. Front. Aging Neurosci. 2022, 14, 783773. [Google Scholar] [CrossRef] [PubMed]
- Raveh, E.; Ben-Shimon, A.; Anisimov, V.; Kreitman, R.; Ben-Ami, E.; Nechushtan, E.; Birman, N.; Drory, V.E. Correlation between Oculometric Measures and Clinical Assessment in ALS Patients Participating in a Phase IIb Clinical Drug Trial. Amyotroph. Lateral Scler. Front. Degener. 2023, 24, 495–501. [Google Scholar] [CrossRef] [PubMed]
- Becerra-García, R.A.; García-Bermúdez, R.; Joya, G. Differentiation of Saccadic Eye Movement Signals. Sensors 2021, 21, 5021. [Google Scholar] [CrossRef] [PubMed]
- Holzman, P.S. Eye-Tracking Dysfunctions in Schizophrenic Patients and Their Relatives. Arch. Gen. Psychiatry 1974, 31, 143. [Google Scholar] [CrossRef] [PubMed]
- Dadu, A.; Satone, V.; Kaur, R.; Hashemi, S.H.; Leonard, H.; Iwaki, H.; Makarious, M.B.; Billingsley, K.J.; Bandres-Ciga, S.; Sargent, L.J.; et al. Identification and Prediction of Parkinson’s Disease Subtypes and Progression Using Machine Learning in Two Cohorts. Npj Park. Dis. 2022, 8, 172. [Google Scholar] [CrossRef] [PubMed]
- Larrazabal, A.J.; García Cena, C.E.; Martínez, C.E. Video-Oculography Eye Tracking towards Clinical Applications: A Review. Comput. Biol. Med. 2019, 108, 57–66. [Google Scholar] [CrossRef] [PubMed]
- Housholder, A.; Reaban, J.; Peregrino, A.; Votta, G.; Mohd, T.K. Evaluating Accuracy of the Tobii Eye Tracker 5. In Intelligent Human Computer Interaction; Kim, J.-H., Singh, M., Khan, J., Tiwary, U.S., Sur, M., Singh, D., Eds.; Lecture Notes in Computer Science; Springer International Publishing: Cham, Switzerland, 2022; Volume 13184, pp. 379–390. ISBN 978-3-030-98403-8. [Google Scholar]
- Onkhar, V.; Dodou, D.; De Winter, J.C.F. Evaluating the Tobii Pro Glasses 2 and 3 in Static and Dynamic Conditions. Behav. Res. Methods 2023. [Google Scholar] [CrossRef] [PubMed]
- Blignaut, P.; Wium, D. Eye-Tracking Data Quality as Affected by Ethnicity and Experimental Design. Behav. Res. Methods 2014, 46, 67–80. [Google Scholar] [CrossRef] [PubMed]
- Chennamma, H.R.; Yuan, X. A Survey on Eye-Gaze Tracking Techniques. arXiv 2013, arXiv:1312.6410. [Google Scholar]
- Hansen, D.W.; Ji, Q. In the Eye of the Beholder: A Survey of Models for Eyes and Gaze. IEEE Trans. Pattern Anal. Mach. Intell. 2010, 32, 478–500. [Google Scholar] [CrossRef]
- Valliappan, N.; Dai, N.; Steinberg, E.; He, J.; Rogers, K.; Ramachandran, V.; Xu, P.; Shojaeizadeh, M.; Guo, L.; Kohlhoff, K.; et al. Accelerating Eye Movement Research via Accurate and Affordable Smartphone Eye Tracking. Nat. Commun. 2020, 11, 4553. [Google Scholar] [CrossRef] [PubMed]
- Lugaresi, C.; Tang, J.; Nash, H.; McClanahan, C.; Uboweja, E.; Hays, M.; Zhang, F.; Chang, C.-L.; Yong, M.G.; Lee, J.; et al. MediaPipe: A Framework for Building Perception Pipelines. arXiv 2019, arXiv:1906.08172v1. [Google Scholar]
- Rosset, I.; Raveh, E.; Shimon, A.B.; Anisimov, V.; Ben-Ami, E.; Kreitman, R.; Breakstone, M. Validation of a Novel Software-based Platform to Extract Oculometric Measures. Acta Ophthalmol. 2022, 100. [Google Scholar] [CrossRef]
- Lambert, L.S.; Hardt, G.F. Polynomial Regression and Response Surface Analysis. Oxf. Bibliogr. Manag. Res. Methods 2018. [Google Scholar] [CrossRef]
- Edwards, J.R. Alternatives to Difference Scores: Polynomial Regression and Response Surface Methodology. Adv. Meas. Data Anal. 2002, 350–400. [Google Scholar]
- Rodrigues, A.C. Response Surface Analysis: A Tutorial for Examining Linear and Curvilinear Effects. Rev. Adm. Contemp. 2021, 25, e200293. [Google Scholar] [CrossRef]
- Salman, M.S.; Sharpe, J.A.; Lillakas, L.; Steinbach, M.J. Square Wave Jerks in Children and Adolescents. Pediatr. Neurol. 2008, 38, 16–19. [Google Scholar] [CrossRef] [PubMed]
- Salvi, S.M.; Akhtar, S.; Currie, Z. Ageing Changes in the Eye. Postgrad. Med. J. 2006, 82, 581–587. [Google Scholar] [CrossRef] [PubMed]
- Zhu, W.; Deng, H. Monocular Free-Head 3D Gaze Tracking With Deep Learning and Geometry Constraints. In Proceedings of the IEEE International Conference on Computer Vision (ICCV), Venice, Italy, 22–29 October 2017. [Google Scholar]
- Lemley, J.; Kar, A.; Drimbarean, A.; Corcoran, P. Efficient CNN Implementation for Eye-Gaze Estimation on Low-Power/Low-Quality Consumer Imaging Systems. arXiv 2018, arXiv:1806.10890. [Google Scholar]
- Wang, D.; Bakhai, A. (Eds.) Clinical Trials: A Practical Guide to Design, Analysis, and Reporting; Remedica: London, UK; Chicago, IL, USA, 2006; ISBN 978-1-901346-72-5. [Google Scholar]
Figure 1.
A schematic description of the gaze detection model configuration, where the only input data are the camera-captured image and the stimuli target location on the display. The output Y is the calibrated gaze point of regard (PoR) on the display.
Figure 1.
A schematic description of the gaze detection model configuration, where the only input data are the camera-captured image and the stimuli target location on the display. The output Y is the calibrated gaze point of regard (PoR) on the display.

Figure 2.
A schematic description of the deep neural network (DNN) gaze detection model, comprising an NN module for eye positioning (lower left, based on the MediaPipe framework) and an NN Gaze Estimation module (right, based on a CNN).
Figure 2.
A schematic description of the deep neural network (DNN) gaze detection model, comprising an NN module for eye positioning (lower left, based on the MediaPipe framework) and an NN Gaze Estimation module (right, based on a CNN).

Figure 3.
The physical experimental setup in the NeuraLight laboratory. The subject is sitting in front of a display presenting the visual stimulation. Both a video camera (on the top of the monitor) and a specialized IR eye tracker (on the bottom of the monitor) record the subject’s eye movements during the examination.

Figure 4.
A schematic diagram demonstrating the stimuli displayed during a single horizontal saccade (left panel) and vertical saccade (right panel) task over time. The time interval containing the displaced stimulus is constant and set to 1500 ms, while the time interval in which the monitor is empty between the disappearance of the biased stimulus and the reappearance of the centered stimulus is constant and set to 300 ms.

Figure 5.
The horizontal gaze location as a function of time of a single subject during a horizontal pro-saccadic session, as measured using a specialized IR eye tracker (green line), video-based NLGEM gaze estimation (blue line), and video-based NLGEM + CGM gaze estimation (red line).
Figure 5.
The horizontal gaze location as a function of time of a single subject during a horizontal pro-saccadic session, as measured using a specialized IR eye tracker (green line), video-based NLGEM gaze estimation (blue line), and video-based NLGEM + CGM gaze estimation (red line).

Figure 6.
The mean average error (MAE) distributions of the video-based NLGEM gaze estimation (blue) and the video-based NLGEM + CGM gaze estimation (red) in the vertical axis (right panel), in the horizontal axis (center panel), and when calculated for its norm (i.e., the absolute distance from the target; left axis). Each box represents the range between the upper and lower quartiles, and the median is indicated by the inner line. The green triangles represent the mean values. The bars extend 1.5 IQRs from the lower and upper quartiles.

Figure 7.
The video-based NLGEM gaze estimation (blue) and the video-based NLGEM + CGM gaze estimation (red) vs. the specialized IR eye tracker gaze estimation (black) during pro-saccade tasks in the horizontal direction (a) and vertical direction (b). The inner panels show the error distribution of the video-based models, with reference to the IR eye tracker.

Figure 8.
The error spatial normalized distribution of the NLGEM video-based gaze estimation (a) and the NLGEM + CGM video-based gaze estimation (b), with reference to the specialized IR eye tracker.
Figure 8.
The error spatial normalized distribution of the NLGEM video-based gaze estimation (a) and the NLGEM + CGM video-based gaze estimation (b), with reference to the specialized IR eye tracker.

Figure 9.
The mean absolute error (MAE) of the video-based NLGEM gaze estimation (blue) and of the video-based NLGEM + CGM gaze estimation (red) as a function of the patient’s age: (a) The absolute norm error; (b) The error in the horizontal axis; (c) The error in the vertical axis. The solid lines represent the corresponding linear fits.


Table 1.
The validation cohort groups with their corresponding number of participants; age range, mean, and standard deviation; and fraction of participants who wore glasses during the test.
Table 1.
The validation cohort groups with their corresponding number of participants; age range, mean, and standard deviation; and fraction of participants who wore glasses during the test.
| Group | Number | Age [yr] | Glasses Used/N | |
|---|---|---|---|---|
| (Min, Max) | (Mean, Std) | |||
| Male | 100 | (19.3, 86.3) | (59.2, 16.6) | 44/100 |
| Female | 159 | (19.3, 83.2) | (65.7, 13.0) | 84/159 |
| Total | 259 | (19.3, 86.3) | (64.5, 13.8) | 128/259 |
Table 2.
Mean average error (MAE) calculations (degrees) for the video-based NLGEM and the NLGEM combined with the CGM gaze estimation location compared with the IR eye tracker. The MAE was calculated separately for the horizontal and vertical axes and the absolute error distance (Norm).
Table 2.
Mean average error (MAE) calculations (degrees) for the video-based NLGEM and the NLGEM combined with the CGM gaze estimation location compared with the IR eye tracker. The MAE was calculated separately for the horizontal and vertical axes and the absolute error distance (Norm).
| Component | MAE NLGEM [deg] | MAE NLGEM + CGM [deg] |
|---|---|---|
| Horizontal | 2.20 | 0.93 |
| Vertical | 3.70 | 1.31 |
| Norm | 4.71 | 1.80 |
Disclaimer/Publisher’s Note: The statements, opinions and data contained in all publications are solely those of the individual author(s) and contributor(s) and not of MDPI and/or the editor(s). MDPI and/or the editor(s) disclaim responsibility for any injury to people or property resulting from any ideas, methods, instructions or products referred to in the content. |
© 2024 by the authors. Licensee MDPI, Basel, Switzerland. This article is an open access article distributed under the terms and conditions of the Creative Commons Attribution (CC BY) license (https://creativecommons.org/licenses/by/4.0/).
Share and Cite
MDPI and ACS Style
Harpaz, E.; Bar-Or, R.Z.; Rosset, I.; Ben-Ami, E. Video-Based Gaze Detection for Oculomotor Abnormality Measurements. Appl. Sci. 2024, 14, 1519. https://doi.org/10.3390/app14041519
AMA Style
Harpaz E, Bar-Or RZ, Rosset I, Ben-Ami E. Video-Based Gaze Detection for Oculomotor Abnormality Measurements. Applied Sciences. 2024; 14(4):1519. https://doi.org/10.3390/app14041519
Chicago/Turabian StyleHarpaz, Eran, Rotem Z. Bar-Or, Israel Rosset, and Edmund Ben-Ami. 2024. "Video-Based Gaze Detection for Oculomotor Abnormality Measurements" Applied Sciences 14, no. 4: 1519. https://doi.org/10.3390/app14041519
Note that from the first issue of 2016, this journal uses article numbers instead of page numbers. See further details here.